P1 smart meter with return values

Moderator: leecollings

Post Reply
FrankVZ
Posts: 30
Joined: Sunday 27 May 2018 12:01
Target OS: -
Domoticz version:
Contact:

P1 smart meter with return values

Post by FrankVZ »

It must be very simple, but somehow I cant find out.

I added the P1/ESMR5 smartmeter successfully. After adding the hardware, the utility counters for kWh and gas/m3 are added automatically.
There are 3 devices added: P1 Smart Meter (GAS), General (Voltage), P1 Smart Meter (Energy, with data 64450;83883;6;0;225;0)
But I don't see within domoticz no user defined values for example, that show actual or totally consumed Watts, nor the returned amount of (k)Wh.

My meter has two counters for returned electricity (solar panels).
But how do I add the return-values into new counters? It seems very hard to do :oops:
How can I assign the supplied gas-values with a counter, just like the electricity counters (the default interval of 1 hour for gas in the graph is too big for me).

Is there someone that can point me in the right direction?
gordonb3
Posts: 111
Joined: Saturday 31 March 2018 22:24
Target OS: Linux
Domoticz version: Custom
Location: Delft, NL
Contact:

Re: P1 smart meter with return values

Post by gordonb3 »

The numbers are already there:
64450 = usage high tariff (kWh)
83883 = usage low tariff (kWh)
6 = delivery high tariff (kWh)
0 = delivery low tariff (kWh)
225 = current usage (Watt)
0 = current delivery (Watt)

The gas meter does in fact only report its counters once per hour. While it would be possible to estimate intermediate values by drawing a straight line between the two reported points, that does not provide any real information at all.
FrankVZ
Posts: 30
Joined: Sunday 27 May 2018 12:01
Target OS: -
Domoticz version:
Contact:

Re: P1 smart meter with return values

Post by FrankVZ »

Hi Gordonb3, thanks for your reply.

My gasmeter updates every 5 minutes, not every hour. Pls see attached picture: a screenshot of the domoticz database (so stored values) and the graph (only once per hour) of my Idx (gasmeter).
I have the same with other counters: I have a counting interval for them of 6 minutes (and that is also stored in the database) but the graphs only show the updates once per hour.

That is why I would like to create a graph like the electricitiy - that type of graph is able to show the shorter intervals!
Gasmeter db 10min.jpg
Gasmeter db 10min.jpg (240.71 KiB) Viewed 6684 times

I see the values/fields of the return Watts are there in the devices list, but how do I get those values into the "electricity layout" counter+graphics?
gordonb3
Posts: 111
Joined: Saturday 31 March 2018 22:24
Target OS: Linux
Domoticz version: Custom
Location: Delft, NL
Contact:

Re: P1 smart meter with return values

Post by gordonb3 »

I see.

Don't have a gas meter myself - I'm on city block heating. Pretty sure that older meters used to report only once per hour. I guess it must have been decided that it would be pointless to use a line graph for usage and they went for a bar chart instead. You should be able to verify that Domoticz does return the 5 minute values by accessing <domoticz IP>/json.htm?type=graph&sensor=counter&idx=100&range=day .The problem will be in on how the graph library is instructed to draw the graph using that raw data, which is in the web pages. It will most likely not look pretty displaying 5 minute intervals in that graph type, so in your case you would need to convert that to a line graph. Maybe you can figure out a way to allow switching the graph type and create a pull request on GitHub?

Regarding electricity, looks like I swapped low and high tariff in that previous listing. Again pretty sure I did see charts posted here that did show delivery numbers. My guess is that with your numbers (total values of 6kWh low tariff + 0kWh high tariff) you're not meeting the filter condition for those to be shown in the graph.
FrankVZ
Posts: 30
Joined: Sunday 27 May 2018 12:01
Target OS: -
Domoticz version:
Contact:

Re: P1 smart meter with return values

Post by FrankVZ »

Thanks again for your effort!
The json command gives hourly values indeed.

But isnt it strange that the return-values/electricity have to be above a certain point before the counters are installed within Domoticz?

I'll give it a try on github!
FrankVZ
Posts: 30
Joined: Sunday 27 May 2018 12:01
Target OS: -
Domoticz version:
Contact:

Re: P1 smart meter with return values

Post by FrankVZ »

Here it is, I hope it is clear enough :)
https://github.com/domoticz/domoticz/issues/2499
gordonb3
Posts: 111
Joined: Saturday 31 March 2018 22:24
Target OS: Linux
Domoticz version: Custom
Location: Delft, NL
Contact:

Re: P1 smart meter with return values

Post by gordonb3 »

Don't think you're getting the point.

The numbers for electricity are there. They're just not shown in the web GUI, which I'm sure is due to a filter in the javascript that controls the graph output. The main issue as I see it is that according to the P1 reports you are actually not delivering any electricity and the graph drawing routine is configured to ignore those 0 values as a service towards users that don't have any power generating devices (solar panels, wind turbines, other?) on site.

If the json for the gas meter is in fact skipping all the values that are not on the full hour than that may be something to look into. Have to say that it does seem plausible for Domoticz to do so, because if I remember correctly even with the older meters that do only report once per hour the database will contain 5 minute values. Which are of course copies of the full hour value.
gordonb3
Posts: 111
Joined: Saturday 31 March 2018 22:24
Target OS: Linux
Domoticz version: Custom
Location: Delft, NL
Contact:

Re: P1 smart meter with return values

Post by gordonb3 »

Okay... quick search shows that yes there is a filter active in the javascript. The controlling parameter is however created by the Domoticz webserver code, which defaults to 'false' and will only be part of the resulting json if the value becomes `true`. Which will be the case if there is at least one value in your delivery counters that is greater than the first value in the range.
FrankVZ
Posts: 30
Joined: Sunday 27 May 2018 12:01
Target OS: -
Domoticz version:
Contact:

Re: P1 smart meter with return values

Post by FrankVZ »

Thanks Gordonb3 for your help.
I agree that there is still no delivery of returned electricity, but I wanted to be prepared if I install a solar system (without having to reinstall the current meters with the loss of historical data for instance).

So it will show up if the solar system is installed - great!

For the gasmeter (and other counters interval length: I dont understand why the case is closed.
because if I remember correctly even with the older meters that do only report once per hour the database will contain 5 minute values. Which are of course copies of the full hour value.
As I showed in my fipo, the values in the database are NOT copies of the previous values within an hour period, but certainly new values. This is the case for other counters too.
E.g.:
Spoiler: show
"21589" "100" "10196" "0" "2018-06-17 17:55:00"
"21596" "100" "10198" "0" "2018-06-17 18:00:00"
"21603" "100" "10198" "0" "2018-06-17 18:05:00"
"21610" "100" "10200" "0" "2018-06-17 18:10:01"

But lets skip the discussion if the gasmeter really sends its data once per second/hour/day yes or no.

Exactly the same issue occurs (I think, anyway) when having a regular counter.
This script will increase the counter once every minute:
Spoiler: show
--[[ getUptime.lua for [ dzVents >= 2.4 ]
]]--

return {
on = { timer = {'every 1 minutes'}
},

logging = { level = domoticz.LOG_DEBUG,
marker = "ForumTest" },

data = { lastState = { initial = "Off" },
secondsOn = { initial = 0 },
lastSwitchTime = { initial = "0" } },

execute = function(dz,trigger)
local myCounterName = dz.devices("ForumTest" )

local function updateCounter()
local myNumber = dz.utils.round( tonumber(dz.data.secondsOn) )
myCounterName.updateCounter( dz.utils.round(( myNumber / 60 ), 2 ) )
end

local Time = require('Time')
t1 = Time(dz.time.rawDate .." " .. dz.time.rawTime)
t2 = Time(dz.data.lastSwitchTime)
deltaTime = t1.compare(t2).secs
dz.data.secondsOn = dz.data.secondsOn + deltaTime
updateCounter()
dz.data.lastSwitchTime = dz.time.rawDate .. " " .. dz.time.rawTime

dz.data.lastSwitchTime = dz.time.rawDate .. " " .. dz.time.rawTime


dz.log("Runtime voor " .. myCounterName.name .. " is " .. (dz.data.secondsOn/ 60),dz.LOG_DEBUG)

end
}
And it does count up, so my log says:
Spoiler: show
dzVents: Debug: ForumTest: Runtime voor ForumTest is 34
The dzVents/data/__data_ForumTestCounter .lua says
Spoiler: show
-- Persistent Data
local multiRefObjects = {

} -- multiRefObjects
local obj1 = {
["secondsOn"] = 2100;
["lastSwitchTime"] = "2018-06-19 11:23:00";
["lastState"] = "Off";
}
return obj1
The counter in the Gui increases every minute, but decreases its interval time from 1 per minute down to once per 5 minutes value (stored in the domoticz.db)

Please note the displayed value "Today 27,29"
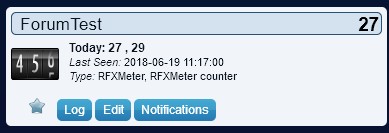
180619 Forumtest.jpg
180619 Forumtest.jpg (12.81 KiB) Viewed 6609 times

Actually counted 29, but in the database only the once per 5 minutes value (27) is stored
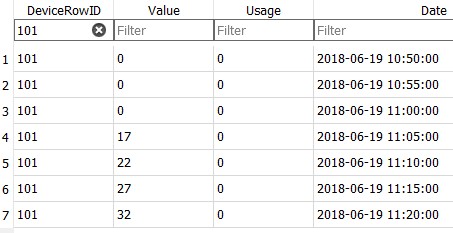
180619 Forumtest database.jpg
180619 Forumtest database.jpg (27.87 KiB) Viewed 6607 times

And within the graph I only get hourly updates:
180619 Forumtest graph.jpg
180619 Forumtest graph.jpg (27.06 KiB) Viewed 6609 times
The json command shows
Spoiler: show
ValueQuantity ""
ValueUnits ""
result
0
d "2018-06-19 10:00"
v "0.0"
1
d "2018-06-19 11:00"
v "41.0"
status "OK"
title "Graph counter day"


It might be a GUI thing - I have no clue. I notice anyway that the sensors input is reduced twice (first -> /5min, 2nd -> /hr) before shown in the graph.

But the question is: how do I get the more detailed graphs, preferably the logging interval time (in this case once/minute)?
Why is the graph for electricity different from the gasmeter values (electricity: /5min, gas /hr, other counters /hr)
It might be too simple since the case is closed at github or do I misunderstand the answer at github (that is possible too :roll: )?
gordonb3
Posts: 111
Joined: Saturday 31 March 2018 22:24
Target OS: Linux
Domoticz version: Custom
Location: Delft, NL
Contact:

Re: P1 smart meter with return values

Post by gordonb3 »

I think the reason for closing is that it was essentially a feature request and those can currently not be processed because development is aiming at releasing a new stable shortly.

With regards to meter values:

The gas meter value will be in every P1 report, so you will get an update every 10 seconds (<= DSMR 4.x) or every 1 second (>= DSMR 5.0). The gas meter itself though will only send an update for those values every hour (<= DSMR 4.x) or every 5 minutes (>= DSMR 5.0).

The current state of every device you have registered in Domoticz is stored in the database and this includes meter values. Do note the the second word in that sentence: current. If you see the value change in the Web GUI, the previous value will no longer be in the database because it was overwritten by the new current value.

Domoticz does keep a history, but not of every single value it read. Every 5 minutes it will put a copy of the then current value in what is called the `shortlog`. Around midnight it will use that shortlog to collect the past day totals and place that in the `real` history.

The shortlog will hold data for up to 7 days, configurable on the settings page. Using the maximum value here will produce 2016 points on the X-axis of the resulting graph, which will not fit on most screens and thus there will be points hidden and you loose what you were after: the ability to see (all) peaks. If you use 1 minute intervals you can practically fill the screen with a single day (1440 points) so yet again points will be hidden if you want to show multiple days for comparison.

In effect it is all a question of choices. Some of which may need reviewing as technology changes. The way it is the gas meter graph is a bar chart and.even though I suppose it should be possible to extend the number of points from 24 to 288 on the X-axis that will most likely look very ugly indeed. So you will be wanting a different type of graph, a line graph, which doesn't really work with older meters.

Of course you can create your own dashboard rather than use the standard provided web GUI. Others have done it as well and some of those projects have been posted here on the forum. The one issue remaining then is to have Domoticz report not just the hourly values but also the 5 minute values in the json output. Which I think it will do if you extend that previous uri with `&method=1`.
FrankVZ
Posts: 30
Joined: Sunday 27 May 2018 12:01
Target OS: -
Domoticz version:
Contact:

Re: P1 smart meter with return values

Post by FrankVZ »

Yes, I know this ESMR5 responds every one second. It is not wise to use it - messages like "error wrong data - line too long" are displayed.
But it is of no use to log every second if only once per hour is displayed, do to a lack of Domoticz logging capabilities.

Even then: skip the thinking about specific the gasmeter: other user defined meters dont display better then once/hour too.

Others like electricity and API called loggings do better. The (darksky) windspeed is even logged and shown as graph with 5 seconds interval.

Strange that user defined logging is not possible better then once/hour.

I am aa bit suprised since it sounds like you are thinking in limitations, but most solutions are there but not for custom graphs. Think even of "if pixellcount > AvailPix then use.slidebar() end" or how it is called. The windspeed just adapts its time-range upon the available space.

The &method=1 option is of no use - I tested it and it does not make any difference at all unfortunatly.

Anyway, as I understand this a waste of time to investigate any further. Costs me hours by now, only hearing what is not possible.
Trying using a different dashboard fails too. Tried Dashticz, but that gives no results at all despite the lucky people where it runs as it should do.
gordonb3
Posts: 111
Joined: Saturday 31 March 2018 22:24
Target OS: Linux
Domoticz version: Custom
Location: Delft, NL
Contact:

Re: P1 smart meter with return values

Post by gordonb3 »

No, I'm not thinking in limitations. I'm talking about choices about what is sane. From historical perspective, i.e. pre ESMR5, it makes absolutely no sense in displaying 12 points that all reference the same time and value in history. As far as I'm concerned a scroll bar in a graph also doesn't make a lot of sense as well. Graphs are about showing trends and peaks and you should be able to do that within a single glimpse. As a rule it will be impossible to distinguish between values like 2.10 and 2.11 in a graph. Should you want such detail you should reference the raw data and find stuff like that 2.11 is actually 2.108.

Yes I understand that from your perspective the historic choice is wrong and I do agree with you that if the data is there you should be able to request it. The thing here is that the choice made is still valid for many users. Why it won't return the intermediate 5 minute data points I don't know and I can't really verify as well. It would work better if you could investigate yourself and figure out a way to support two different graphs for gas usage: the current bar chart for older meters and a line graph for ESMR5+ meters.
FrankVZ
Posts: 30
Joined: Sunday 27 May 2018 12:01
Target OS: -
Domoticz version:
Contact:

Re: P1 smart meter with return values

Post by FrankVZ »

Well, that is exactly why I ask the question here.
Again: forget "the gas only" question.

I did a lot of searching and Google Did overtime. I can't find the solution myself.
If it is for cookies, flies in my kitchen, gasmetervalues, counting runtimes.....

So how do I make a line graph of data with a user defined time interval?
Who knows the way to go?
gordonb3
Posts: 111
Joined: Saturday 31 March 2018 22:24
Target OS: Linux
Domoticz version: Custom
Location: Delft, NL
Contact:

Re: P1 smart meter with return values

Post by gordonb3 »

What usually works for me is to look at code that does what I want (but with wrong data) and than compare that with code that doesn't do what I want. Next I try to find out what causes that difference and last I try to figure out how I can improve it.
FrankVZ
Posts: 30
Joined: Sunday 27 May 2018 12:01
Target OS: -
Domoticz version:
Contact:

Re: P1 smart meter with return values

Post by FrankVZ »

That is usually the I do it too, but then still need a good starting point.

That way I learned a bit with dzVents/lua/python. Blocky only by myself - it looks simple bit you certainly have to stick to some rules. It is not a regular if/then/else for instance.

Also for the graphs: I have no clue where to start. The graphs for e.g. Darksky are added from within Domoticz so I have no idea where to get that specific kind of script. The same for the electricity graph.
Where can I find these scripts?
gordonb3
Posts: 111
Joined: Saturday 31 March 2018 22:24
Target OS: Linux
Domoticz version: Custom
Location: Delft, NL
Contact:

Re: P1 smart meter with return values

Post by gordonb3 »

The highcharts scripts themselves are in www/js but those shouldn't really concern you, unless of course you want to call these from another front-end. Looks like the construct for the various graphs is all done in domoticz.js. I just found this by doing a `grep -r gas`.
Post Reply

Who is online

Users browsing this forum: No registered users and 0 guests