Thanks Gordonb3 for your help.
I agree that there is still no delivery of returned electricity, but I wanted to be prepared if I install a solar system (without having to reinstall the current meters with the loss of historical data for instance).
So it will show up if the solar system is installed - great!
For the gasmeter (and other counters interval length: I dont understand why the case is closed.
because if I remember correctly even with the older meters that do only report once per hour the database will contain 5 minute values. Which are of course copies of the full hour value.
As I showed in my fipo, the values in the database are NOT copies of the previous values within an hour period, but certainly new values. This is the case for other counters too.
E.g.:
- Spoiler: show
- "21589" "100" "10196" "0" "2018-06-17 17:55:00"
"21596" "100" "10198" "0" "2018-06-17 18:00:00"
"21603" "100" "10198" "0" "2018-06-17 18:05:00"
"21610" "100" "10200" "0" "2018-06-17 18:10:01"
But lets skip the discussion if the gasmeter really sends its data once per second/hour/day yes or no.
Exactly the same issue occurs (I think, anyway) when having a regular counter.
This script will increase the counter once every minute:
- Spoiler: show
-
--[[ getUptime.lua for [ dzVents >= 2.4 ]
]]--
return {
on = { timer = {'every 1 minutes'}
},
logging = { level = domoticz.LOG_DEBUG,
marker = "ForumTest" },
data = { lastState = { initial = "Off" },
secondsOn = { initial = 0 },
lastSwitchTime = { initial = "0" } },
execute = function(dz,trigger)
local myCounterName = dz.devices("ForumTest" )
local function updateCounter()
local myNumber = dz.utils.round( tonumber(dz.data.secondsOn) )
myCounterName.updateCounter( dz.utils.round(( myNumber / 60 ), 2 ) )
end
local Time = require('Time')
t1 = Time(dz.time.rawDate .." " .. dz.time.rawTime)
t2 = Time(dz.data.lastSwitchTime)
deltaTime = t1.compare(t2).secs
dz.data.secondsOn = dz.data.secondsOn + deltaTime
updateCounter()
dz.data.lastSwitchTime = dz.time.rawDate .. " " .. dz.time.rawTime
dz.data.lastSwitchTime = dz.time.rawDate .. " " .. dz.time.rawTime
dz.log("Runtime voor " .. myCounterName.name .. " is " .. (dz.data.secondsOn/ 60),dz.LOG_DEBUG)
end
}
And it does count up, so my log says:
- Spoiler: show
- dzVents: Debug: ForumTest: Runtime voor ForumTest is 34
The dzVents/data/__data_ForumTestCounter .lua says
- Spoiler: show
- -- Persistent Data
local multiRefObjects = {
} -- multiRefObjects
local obj1 = {
["secondsOn"] = 2100;
["lastSwitchTime"] = "2018-06-19 11:23:00";
["lastState"] = "Off";
}
return obj1
The counter in the Gui increases every minute, but decreases its interval time from 1 per minute down to once per 5 minutes value (stored in the domoticz.db)
Please note the displayed value "Today 27,29"
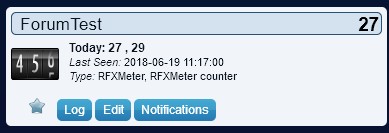
- 180619 Forumtest.jpg (12.81 KiB) Viewed 7351 times
Actually counted 29, but in the database only the once per 5 minutes value (27) is stored
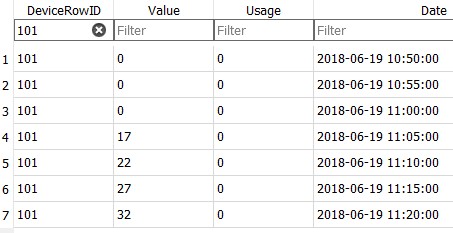
- 180619 Forumtest database.jpg (27.87 KiB) Viewed 7349 times
And within the graph I only get hourly updates:
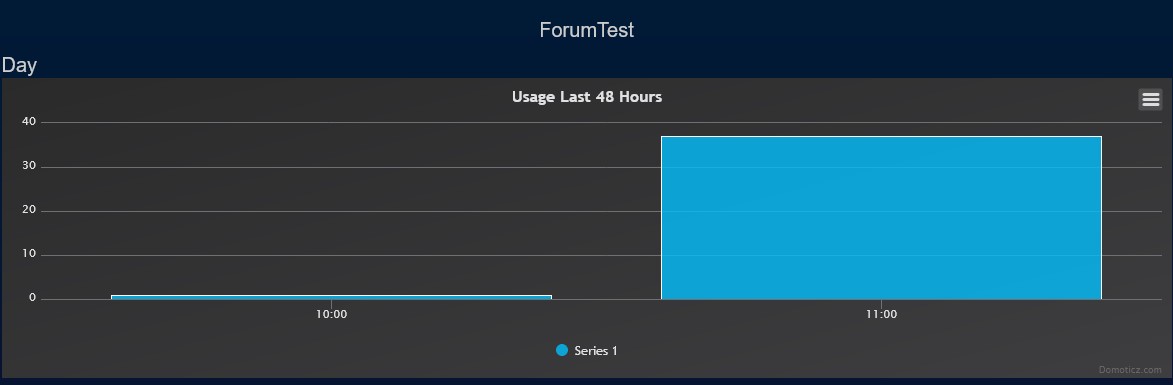
- 180619 Forumtest graph.jpg (27.06 KiB) Viewed 7351 times
The json command shows
- Spoiler: show
- ValueQuantity ""
ValueUnits ""
result
0
d "2018-06-19 10:00"
v "0.0"
1
d "2018-06-19 11:00"
v "41.0"
status "OK"
title "Graph counter day"
It might be a GUI thing - I have no clue. I notice anyway that the sensors input is reduced twice (first -> /5min, 2nd -> /hr) before shown in the graph.
But the question is: how do I get the more detailed graphs, preferably the logging interval time (in this case once/minute)?
Why is the graph for electricity different from the gasmeter values (electricity: /5min, gas /hr, other counters /hr)
It might be too simple since the case is closed at github or do I misunderstand the answer at github (that is possible too

)?