Just to be sure I understand. You have a P1 Energy Meter, idx 199. When you add it as a block, I guess it appears as 3 blocks on the page (as my energy meter does). Are you saying you only want the popup to work on the first block, i.e. 199_1?Sjonnie2017 wrote: Thursday 27 February 2020 18:57 OK, and do you think that can be solved? Would it be possible in the future to add a popup graph to an arbitrary block?
Multiple sources in one graph
Moderators: leecollings, htilburgs, robgeerts
- clinkadink
- Posts: 417
- Joined: Tuesday 31 December 2019 1:15
- Target OS: Linux
- Domoticz version: 2020.2
- Location: Swindon, UK
- Contact:
Re: Multiple sources in one graph
"UI is the saddle, the stirrups, & the reins. UX is the feeling you get being able to ride the horse."
- Sjonnie2017
- Posts: 372
- Joined: Wednesday 02 August 2017 19:43
- Target OS: Linux
- Domoticz version: Latest ß
- Location: The Netherlands
- Contact:
Re: Multiple sources in one graph
I hope I can explain.
My energymeter produces 6 blocks (Now, Today, Total, Total Day/Night, Total Day, Total Night). I have created three blocks for the values I would like to see. In my case Now (199_1), Today (199_2) and Total (199_3). I would like to be able to apply the same popup graph to all three blocks.
Hope this makes sense.
Greetz,
Sjonnie
ConBee II - TRÅDFRI lights + switches, loads of ChingLing dimmers and switches, Heiman and Xiaomi sensors
SolarEdge SE4000H (with active modbus_tcp)
YouLess Energy meter
Shelly 2.5 in roller shutter mode
SolarEdge SE4000H (with active modbus_tcp)
YouLess Energy meter
Shelly 2.5 in roller shutter mode
- clinkadink
- Posts: 417
- Joined: Tuesday 31 December 2019 1:15
- Target OS: Linux
- Domoticz version: 2020.2
- Location: Swindon, UK
- Contact:
Re: Multiple sources in one graph
Yes, last night it was updated to a fix graph refresh issue with custom data. The options seem to be affected. Am looking at this now.flemm wrote: Thursday 27 February 2020 10:30 Since the update i git-pulled this morning, my custom axis label colours and gridline options stopped working. Has something changed in how to define 'options' variables?
"UI is the saddle, the stirrups, & the reins. UX is the feeling you get being able to ride the horse."
- clinkadink
- Posts: 417
- Joined: Tuesday 31 December 2019 1:15
- Target OS: Linux
- Domoticz version: 2020.2
- Location: Swindon, UK
- Contact:
Re: Multiple sources in one graph
I get it. Hmmm. A rather unique use case I certainly have not contimplatedSjonnie2017 wrote: Thursday 27 February 2020 19:44 My energymeter produces 6 blocks (Now, Today, Total, Total Day/Night, Total Day, Total Night). I have created three blocks for the values I would like to see. In my case Now (199_1), Today (199_2) and Total (199_3). I would like to be able to apply the same popup graph to all three blocks.
Instead of defining the blocks for the subdevices you want to see, e.g. 199_1, 199_2, etc. Why don't you just define one, i.e. block[199]. This should create 6 subdevice blocks, but use the following to hide the ones you don't want. This way, the existing popup feature should work.
- Spoiler: show
"UI is the saddle, the stirrups, & the reins. UX is the feeling you get being able to ride the horse."
- Sjonnie2017
- Posts: 372
- Joined: Wednesday 02 August 2017 19:43
- Target OS: Linux
- Domoticz version: Latest ß
- Location: The Netherlands
- Contact:
Re: Multiple sources in one graph
I was thinking I might try to suppress showing the blocks I don't want by using the custom.css. Your code saved me time finding out how to do that. Thank you.clinkadink wrote: Thursday 27 February 2020 19:54 I get it. Hmmm. A rather unique use case I certainly have not contimplatedLet me think about it. In the meantime, you could try a css based alternative. I haven't tested this, so it may or may not work ...
Instead of defining the blocks for the subdevices you want to see, e.g. 199_1, 199_2, etc. Why don't you just define one, i.e. block[199]. This should create 6 subdevice blocks, but use the following to hide the ones you don't want. This way, the existing popup feature should work.
- Spoiler: show
Will post back results of course
Greetz,
Sjonnie
ConBee II - TRÅDFRI lights + switches, loads of ChingLing dimmers and switches, Heiman and Xiaomi sensors
SolarEdge SE4000H (with active modbus_tcp)
YouLess Energy meter
Shelly 2.5 in roller shutter mode
SolarEdge SE4000H (with active modbus_tcp)
YouLess Energy meter
Shelly 2.5 in roller shutter mode
- clinkadink
- Posts: 417
- Joined: Tuesday 31 December 2019 1:15
- Target OS: Linux
- Domoticz version: 2020.2
- Location: Swindon, UK
- Contact:
Re: Multiple sources in one graph
I have updated the beta, please can you try and let me know if this issue is now resolved? Thanks.flemm wrote: Thursday 27 February 2020 10:30 Since the update i git-pulled this morning, my custom axis label colours and gridline options stopped working.
"UI is the saddle, the stirrups, & the reins. UX is the feeling you get being able to ride the horse."
- flemm
- Posts: 25
- Joined: Thursday 20 February 2020 8:04
- Target OS: Raspberry Pi / ODroid
- Domoticz version: 4.11780
- Location: Netherlands
- Contact:
Re: Multiple sources in one graph
Yes, it is!clinkadink wrote: Friday 28 February 2020 2:41 I have updated the beta, please can you try and let me know if this issue is now resolved? Thanks.
You sir, are -again- the hero of the day. Thank you!
Mario ipsum RGB mushroom 1-up.
- Sjonnie2017
- Posts: 372
- Joined: Wednesday 02 August 2017 19:43
- Target OS: Linux
- Domoticz version: Latest ß
- Location: The Netherlands
- Contact:
Re: Multiple sources in one graph
Been playing around with which (sub)blocks to show and which not. This is what I ended up wit:clinkadink wrote: Thursday 27 February 2020 19:54 I get it. Hmmm. A rather unique use case I certainly have not contimplatedLet me think about it. In the meantime, you could try a css based alternative. I haven't tested this, so it may or may not work ...
Instead of defining the blocks for the subdevices you want to see, e.g. 199_1, 199_2, etc. Why don't you just define one, i.e. block[199]. This should create 6 subdevice blocks, but use the following to hide the ones you don't want. This way, the existing popup feature should work.
- Spoiler: show
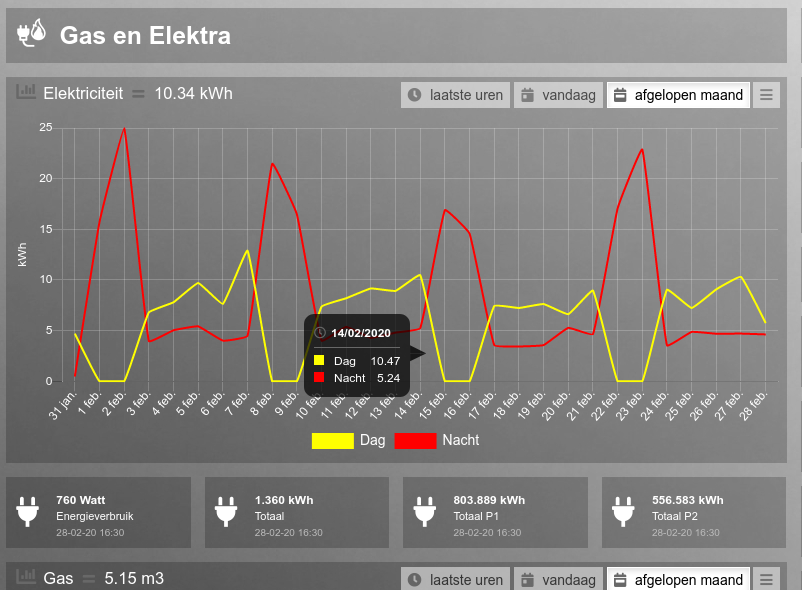
Happy camper!
@flemm is right!
Greetz,You sir, are -again- the hero of the day. Thank you!
Sjonnie
ConBee II - TRÅDFRI lights + switches, loads of ChingLing dimmers and switches, Heiman and Xiaomi sensors
SolarEdge SE4000H (with active modbus_tcp)
YouLess Energy meter
Shelly 2.5 in roller shutter mode
SolarEdge SE4000H (with active modbus_tcp)
YouLess Energy meter
Shelly 2.5 in roller shutter mode
- Sjonnie2017
- Posts: 372
- Joined: Wednesday 02 August 2017 19:43
- Target OS: Linux
- Domoticz version: Latest ß
- Location: The Netherlands
- Contact:
Re: Multiple sources in one graph
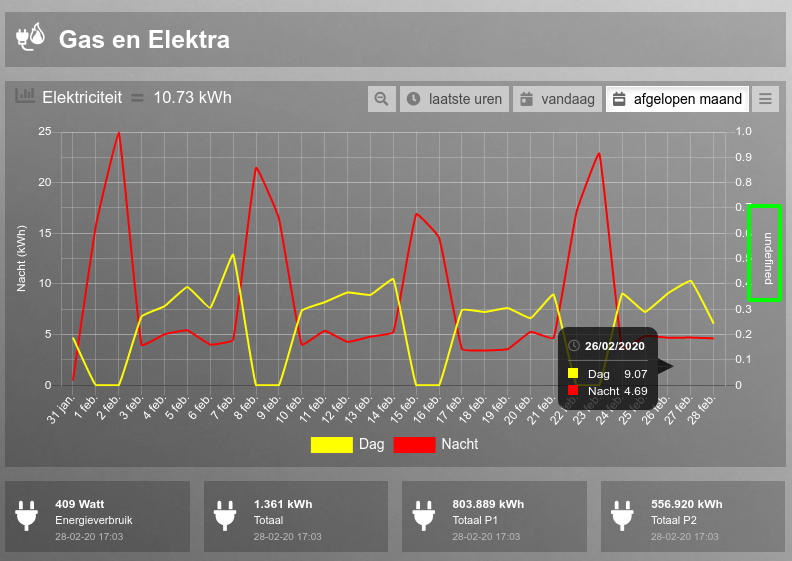
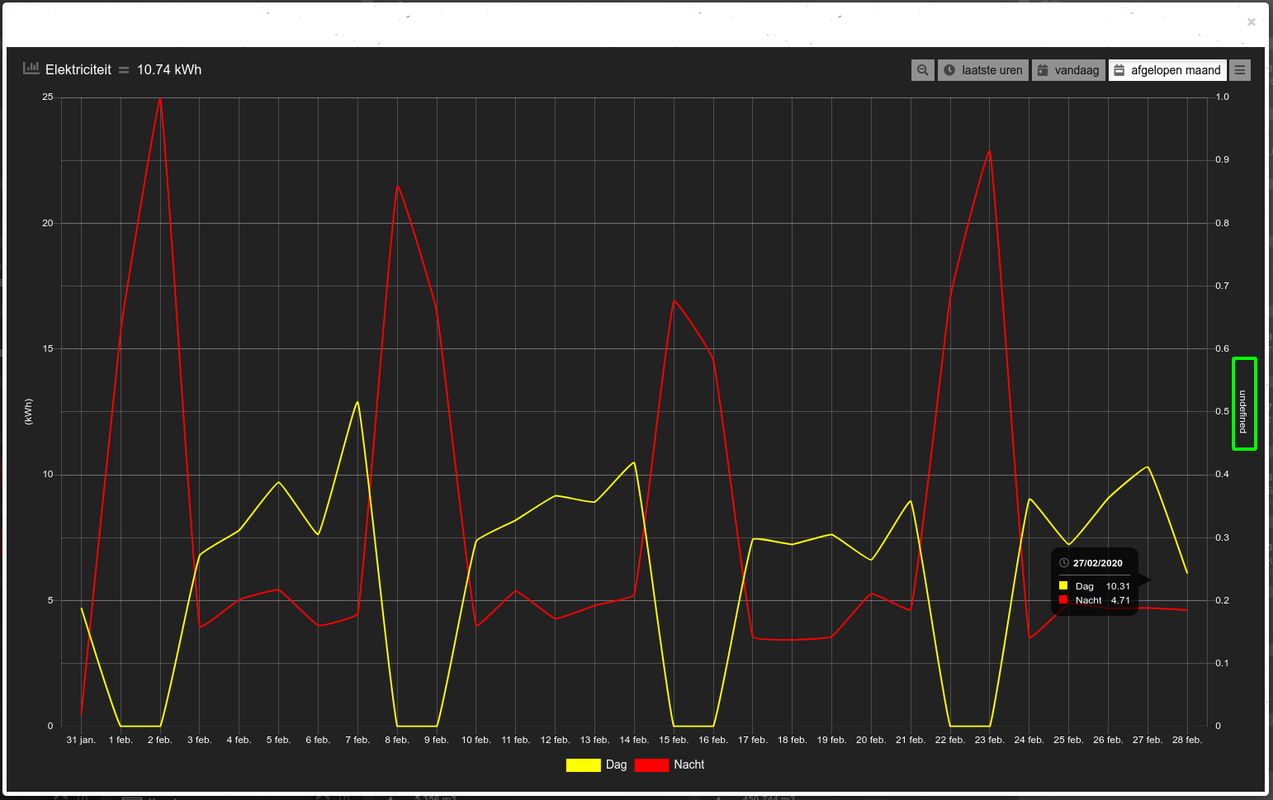
Just updated to latest beta and saw that I now have an extra axis in my electricity graph (all other graphs are unchanged). So I thought I'd share the pictures and the debug code with you to see if this can be fixed 
The pictures:
Dashboard:
Popup:
Debug code for dashboard graph:
Sjonnie
The pictures:
Dashboard:

Popup:

Debug code for dashboard graph:
- Spoiler: show
- Spoiler: show
Sjonnie
ConBee II - TRÅDFRI lights + switches, loads of ChingLing dimmers and switches, Heiman and Xiaomi sensors
SolarEdge SE4000H (with active modbus_tcp)
YouLess Energy meter
Shelly 2.5 in roller shutter mode
SolarEdge SE4000H (with active modbus_tcp)
YouLess Energy meter
Shelly 2.5 in roller shutter mode
- clinkadink
- Posts: 417
- Joined: Tuesday 31 December 2019 1:15
- Target OS: Linux
- Domoticz version: 2020.2
- Location: Swindon, UK
- Contact:
Re: Multiple sources in one graph
Good spot, I have fixed this at my end now. I am working on something else at the moment, but hope to deploy this laterSjonnie2017 wrote: Friday 28 February 2020 17:13 Just updated to latest beta and saw that I now have an extra axis in my electricity graph (all other graphs are unchanged). So I thought I'd share the pictures and the debug code with you to see if this can be fixed
"UI is the saddle, the stirrups, & the reins. UX is the feeling you get being able to ride the horse."
- Sjonnie2017
- Posts: 372
- Joined: Wednesday 02 August 2017 19:43
- Target OS: Linux
- Domoticz version: Latest ß
- Location: The Netherlands
- Contact:
Re: Multiple sources in one graph
Excellent! Tx!clinkadink wrote: Friday 28 February 2020 19:20 Good spot, I have fixed this at my end now. I am working on something else at the moment, but hope to deploy this later
Greetz,
Sjonnie
ConBee II - TRÅDFRI lights + switches, loads of ChingLing dimmers and switches, Heiman and Xiaomi sensors
SolarEdge SE4000H (with active modbus_tcp)
YouLess Energy meter
Shelly 2.5 in roller shutter mode
SolarEdge SE4000H (with active modbus_tcp)
YouLess Energy meter
Shelly 2.5 in roller shutter mode
- clinkadink
- Posts: 417
- Joined: Tuesday 31 December 2019 1:15
- Target OS: Linux
- Domoticz version: 2020.2
- Location: Swindon, UK
- Contact:
Re: Multiple sources in one graph
Graphs has been updated this evening. Please see here:
https://www.domoticz.com/forum/viewtopi ... 67&t=31534
https://www.domoticz.com/forum/viewtopi ... 67&t=31534
"UI is the saddle, the stirrups, & the reins. UX is the feeling you get being able to ride the horse."
-
Kranendijk
- Posts: 60
- Joined: Wednesday 29 May 2019 14:39
- Target OS: Raspberry Pi / ODroid
- Domoticz version: 4.10717
- Location: Zwolle
- Contact:
Re: Multiple sources in one graph
Great!!!
- Sjonnie2017
- Posts: 372
- Joined: Wednesday 02 August 2017 19:43
- Target OS: Linux
- Domoticz version: Latest ß
- Location: The Netherlands
- Contact:
Re: Multiple sources in one graph
Fixed the undefined value. Tx! 
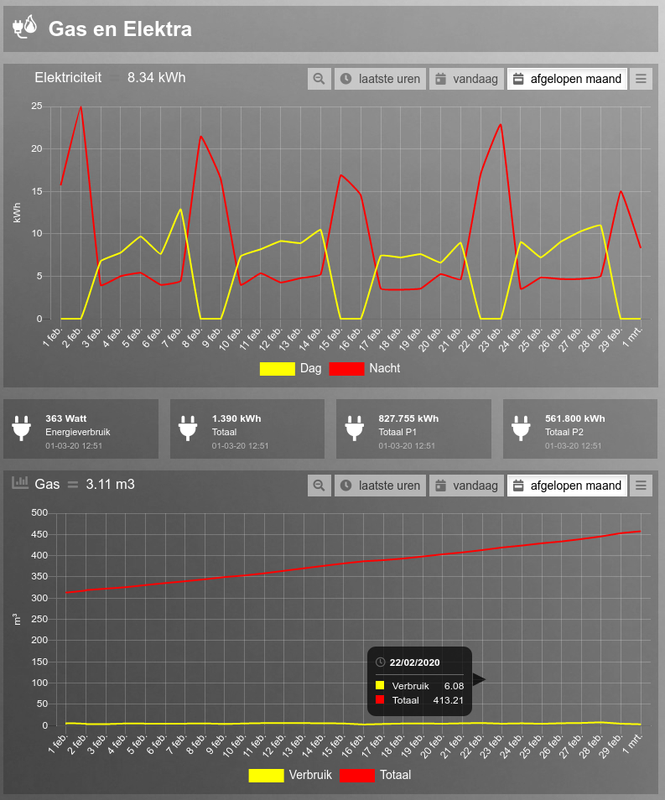
Now I am going to do some research if it is possible to get 2 Y-axis for my gas graph. Left axis for Total and right axis for consumption (Verbruik). Should be possible. Tried Cartesian parameter but 5e+0 and 5e+1 is not very intuitive
Greetz,
Sjonnie

Now I am going to do some research if it is possible to get 2 Y-axis for my gas graph. Left axis for Total and right axis for consumption (Verbruik). Should be possible. Tried Cartesian parameter but 5e+0 and 5e+1 is not very intuitive
Greetz,
Sjonnie
ConBee II - TRÅDFRI lights + switches, loads of ChingLing dimmers and switches, Heiman and Xiaomi sensors
SolarEdge SE4000H (with active modbus_tcp)
YouLess Energy meter
Shelly 2.5 in roller shutter mode
SolarEdge SE4000H (with active modbus_tcp)
YouLess Energy meter
Shelly 2.5 in roller shutter mode
- clinkadink
- Posts: 417
- Joined: Tuesday 31 December 2019 1:15
- Target OS: Linux
- Domoticz version: 2020.2
- Location: Swindon, UK
- Contact:
Re: Multiple sources in one graph
You should be able to do that with custom data, and adding your own Y labels, e.g.
In the example below, I am specifying what Y labels I want, regardless of what Dashticz detects them as ...
Code: Select all
ylabels: ['m3','m3 total'],- Spoiler: show
"UI is the saddle, the stirrups, & the reins. UX is the feeling you get being able to ride the horse."
- Sjonnie2017
- Posts: 372
- Joined: Wednesday 02 August 2017 19:43
- Target OS: Linux
- Domoticz version: Latest ß
- Location: The Netherlands
- Contact:
Re: Multiple sources in one graph
I didn't even get a chance to figure out how to build the graphs I wanted.  You beat me to it (and saved me a lot of reading
  )! Thank you very much.
My gas graph now looks absolutely stunning!
The graph in all it's splendor:
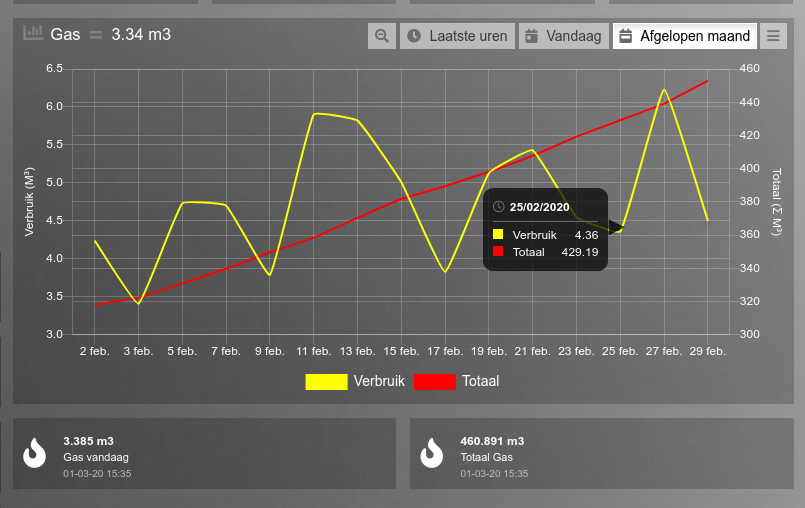
The code that makes it happen:
Took some time to get it in a (for me  ) readable format but there you have it.
Greetz,
Sjonnie
My gas graph now looks absolutely stunning!
The graph in all it's splendor:

The code that makes it happen:
Code: Select all
blocks[grafiek_gas] = {}
blocks[grafiek_gas]['title'] = 'Gas';
blocks[grafiek_gas]['devices'] = [200];
blocks[grafiek_gas]['width'] = 12;
blocks[grafiek_gas]['height'] = '400px';
blocks[grafiek_gas]['interval'] = 2;
blocks[grafiek_gas]['graphTypes'] = ['v', 'c'];
blocks[grafiek_gas]['zoom'] = 'x';
blocks[grafiek_gas]['toolTipStyle'] = true;
blocks[grafiek_gas]['debugButton'] = true;
blocks[grafiek_gas]['datasetColors'] = ['yellow', 'red'];
blocks[grafiek_gas]['legend'] = {'v_200': 'Verbruik', 'c_200': 'Totaal'};
blocks[grafiek_gas]['custom'] = {
        "Laatste uren": {range: 'day',filter: '4 hours',data: {Verbruik: 'd.v_200', Totaal: 'd.c_200'}},
        "Vandaag": {range: 'day',filter: '24 hours',data: {Verbruik: 'd.v_200', Totaal: 'd.c_200'}},
        "Afgelopen maand": {ylabels: ['M³', 'Ʃ M³'],range: 'year',filter: '1 months',data: {Verbruik: 'd.v_200', Totaal: 'd.c_200'}}
}You'll get my vote!Clinkadink for president!
Greetz,
Sjonnie
ConBee II - TRÅDFRI lights + switches, loads of ChingLing dimmers and switches, Heiman and Xiaomi sensors
SolarEdge SE4000H (with active modbus_tcp)
YouLess Energy meter
Shelly 2.5 in roller shutter mode
SolarEdge SE4000H (with active modbus_tcp)
YouLess Energy meter
Shelly 2.5 in roller shutter mode
- clinkadink
- Posts: 417
- Joined: Tuesday 31 December 2019 1:15
- Target OS: Linux
- Domoticz version: 2020.2
- Location: Swindon, UK
- Contact:
Re: Multiple sources in one graph
Looks great, well done! 
"UI is the saddle, the stirrups, & the reins. UX is the feeling you get being able to ride the horse."
- EdwinK
- Posts: 1820
- Joined: Sunday 22 January 2017 21:46
- Target OS: Raspberry Pi / ODroid
- Domoticz version: BETA
- Location: Rhoon
- Contact:
Re: Multiple sources in one graph
I agree. Too bad it won't work for me. When ever I try this, dashticz ends up like this:Sjonnie2017 wrote: Sunday 01 March 2020 15:39 I didn't even get a chance to figure out how to build the graphs I wanted.You beat me to it (and saved me a lot of reading
)! Thank you very much.
My gas graph now looks absolutely stunning!

I've done a git pull to get the latest version.
I changed 'blocks[grafiek_gas]['devices'] = [200];' to 'blocks[grafiek_gas]['devices'] = [2];' as that is the idx of my Gas device
You'll get my vote!Clinkadink for president!
Greetz,
Sjonnie
Running latest BETA on a Pi-3 | Toon® Thermostat (rooted) | Hue | Tuya | IKEA tradfri | Dashticz V3 on Lenovo Huawei Tablet | Conbee
- clinkadink
- Posts: 417
- Joined: Tuesday 31 December 2019 1:15
- Target OS: Linux
- Domoticz version: 2020.2
- Location: Swindon, UK
- Contact:
Re: Multiple sources in one graph
When my dash ends up like that, its normally because of a syntax error or typo in config.js.EdwinK wrote: Sunday 01 March 2020 16:39 I agree. Too bad it won't work for me. When ever I try this, dashticz ends up like this:
I've done a git pull to get the latest version.
I changed 'blocks[grafiek_gas]['devices'] = [200];' to 'blocks[grafiek_gas]['devices'] = [2];' as that is the idx of my Gas device
I am unsure what this refers to without seeing the full graph block. I am assuming that grafiek_gas is a variable.
Code: Select all
blocks[grafiek_gas]['devices'] = [2];"UI is the saddle, the stirrups, & the reins. UX is the feeling you get being able to ride the horse."
- EdwinK
- Posts: 1820
- Joined: Sunday 22 January 2017 21:46
- Target OS: Raspberry Pi / ODroid
- Domoticz version: BETA
- Location: Rhoon
- Contact:
Re: Multiple sources in one graph
I've copy-ed the example from Sjonnie, and changed aboce line. I guess I need to change this in a variable.clinkadink wrote: Sunday 01 March 2020 17:49When my dash ends up like that, its normally because of a syntax error or typo in config.js.EdwinK wrote: Sunday 01 March 2020 16:39 I agree. Too bad it won't work for me. When ever I try this, dashticz ends up like this:
I've done a git pull to get the latest version.
I changed 'blocks[grafiek_gas]['devices'] = [200];' to 'blocks[grafiek_gas]['devices'] = [2];' as that is the idx of my Gas device
I am unsure what this refers to without seeing the full graph block. I am assuming that grafiek_gas is a variable.Code: Select all
blocks[grafiek_gas]['devices'] = [2];
Running latest BETA on a Pi-3 | Toon® Thermostat (rooted) | Hue | Tuya | IKEA tradfri | Dashticz V3 on Lenovo Huawei Tablet | Conbee
Who is online
Users browsing this forum: No registered users and 1 guest