Multiple sources in one graph
Moderators: leecollings, htilburgs, robgeerts
- HansieNL
- Posts: 969
- Joined: Monday 28 September 2015 15:13
- Target OS: Raspberry Pi / ODroid
- Domoticz version:
- Contact:
Re: Multiple sources in one graph
I don’t need the current values in the header. So a new property would be great.
Blah blah blah
- clinkadink
- Posts: 417
- Joined: Tuesday 31 December 2019 1:15
- Target OS: Linux
- Domoticz version: 2020.2
- Location: Swindon, UK
- Contact:
Re: Multiple sources in one graph
I have updated the Dashticz graph this evening.
Fixed:
(1) The graph header value fix for single devices with sub-devices (multidata). This now shows the current value (as before the last update).
New:
(1) New graph block parameter added; “GroupBy”. This allows users to group their data by hour, day, week or month, where applicable ranges are used. The GroupBy param can be set on the graph block as follows:


The GroupBy function will either:
For example, the user as an Energy meter block defined as follows:
Changes
(1) The graph zoom control has been updated. There is no longer a requirement for config[‘graph_zoom’] to be set in the config.js. This can be removed. Instead, a new graph block parameter has been added; “zoom”.
If set, the new param accepts 4 values: “x”, “y”, “xy” or false. This allows the user to decide which graph they want to apply zoom controls to, but also, which orientation.

The "Wind" graph after zoom "x":

(2) The graph buttons have been tweaked slightly to make it easier for the user to tell which button is applied. Users can amend there preference in the CSS by changing the button opacity (as required).
Fixed:
(1) The graph header value fix for single devices with sub-devices (multidata). This now shows the current value (as before the last update).
New:
(1) New graph block parameter added; “GroupBy”. This allows users to group their data by hour, day, week or month, where applicable ranges are used. The GroupBy param can be set on the graph block as follows:
- Spoiler: show
- Spoiler: show


The GroupBy function will either:
- The “sum” of all values together for that group
- Provide the “average” of all values for that group
- Counter, Rain – uses the “Add’ calculation
- Temperature, Custom Sensor and Percentage – uses the “Average” calculation
- Spoiler: show
For example, the user as an Energy meter block defined as follows:
- Spoiler: show
- Spoiler: show

Changes
(1) The graph zoom control has been updated. There is no longer a requirement for config[‘graph_zoom’] to be set in the config.js. This can be removed. Instead, a new graph block parameter has been added; “zoom”.
If set, the new param accepts 4 values: “x”, “y”, “xy” or false. This allows the user to decide which graph they want to apply zoom controls to, but also, which orientation.
- x – allow zooming on the x axis (left to right)
- y – allow zooming on the y axis (top to bottom)
- xy – allow zooming in any direction
- false – disable zooming, do not show zoom button
- Spoiler: show

The "Wind" graph after zoom "x":

(2) The graph buttons have been tweaked slightly to make it easier for the user to tell which button is applied. Users can amend there preference in the CSS by changing the button opacity (as required).
- Spoiler: show
"UI is the saddle, the stirrups, & the reins. UX is the feeling you get being able to ride the horse."
-
Jimster
- Posts: 82
- Joined: Tuesday 04 February 2020 11:42
- Target OS: Raspberry Pi / ODroid
- Domoticz version: 2020.2
- Location: The Netherlands
- Contact:
Re: Multiple sources in one graph
I tried the new popup function, works great!
- clinkadink
- Posts: 417
- Joined: Tuesday 31 December 2019 1:15
- Target OS: Linux
- Domoticz version: 2020.2
- Location: Swindon, UK
- Contact:
Re: Multiple sources in one graph
Great! Thanks for letting me know.
"UI is the saddle, the stirrups, & the reins. UX is the feeling you get being able to ride the horse."
- flemm
- Posts: 25
- Joined: Thursday 20 February 2020 8:04
- Target OS: Raspberry Pi / ODroid
- Domoticz version: 4.11780
- Location: Netherlands
- Contact:
Re: Multiple sources in one graph
Nice, love the groupBy feature, exactly what I needed for my p1 meter graph. Love the zoom feature, too. Thank you!
It doesn't work very well with my temp/humidity chart though, the average temperature is somehow calculated as 8-10 degrees. I've commented out all the custom (mostly visual) options, but that doesn't make a difference..
It doesn't work very well with my temp/humidity chart though, the average temperature is somehow calculated as 8-10 degrees. I've commented out all the custom (mostly visual) options, but that doesn't make a difference..
- Attachments
-
- Screenshot 2020-02-24 at 16.21.19.png (179.86 KiB) Viewed 1942 times
Mario ipsum RGB mushroom 1-up.
- clinkadink
- Posts: 417
- Joined: Tuesday 31 December 2019 1:15
- Target OS: Linux
- Domoticz version: 2020.2
- Location: Swindon, UK
- Contact:
Re: Multiple sources in one graph
Please could you add "debugButton: true" to the graph block, save, refresh the browser, press the debug button above the graph, and provide a screenshot of the debug window. Thanks.flemm wrote: Monday 24 February 2020 16:23 It doesn't work very well with my temp/humidity chart though, the average temperature is somehow calculated as 8-10 degrees.
"UI is the saddle, the stirrups, & the reins. UX is the feeling you get being able to ride the horse."
- flemm
- Posts: 25
- Joined: Thursday 20 February 2020 8:04
- Target OS: Raspberry Pi / ODroid
- Domoticz version: 4.11780
- Location: Netherlands
- Contact:
Re: Multiple sources in one graph
Of course, with pleasure!
Code: Select all
{
  "blockId": "block_6",
  "block": {
    "devices": [
      9
    ],
    "datasetColors": [
      "rgba(255, 61, 61, 0.8)",
      "rgba(50, 180, 250, 0.8)"
    ],
    "barWidth": 0.9,
    "beginAtZero": false,
    "borderColors": [
      "rgba(255, 61, 61, 0.8)",
      "rgba(50, 180, 250, 0.8)"
    ],
    "borderDash": [],
    "borderWidth": 2,
    "buttonsBorder": "white",
    "buttonsColor": "black",
    "buttonsFill": "white",
    "buttonsIcon": "#686868",
    "buttonsMarginX": 2,
    "buttonsMarginY": 0,
    "buttonsPadX": 6,
    "buttonsPadY": 2,
    "buttonsRadius": 0,
    "buttonsShadow": false,
    "buttonsSize": 10,
    "buttonsText": false,
    "cartesian": "linear",
    "custom": {
      "vandaag": {
        "range": "day",
        "groupBy": "hour",
        "filter": "24 hours",
        "data": {
          "Temperatuur": "d.te_9",
          "Luchtvochtigheid": "d.hu_9"
        }
      },
      "week": {
        "range": "month",
        "groupBy": "day",
        "filter": "7 days",
        "data": {
          "Temperatuur": "d.te_9",
          "Luchtvochtigheid": "d.hu_9"
        },
        "options": {
          "scales": {
            "yAxes": [
              {
                "ticks": {
                  "fontColor": "rgba(255,255,255,0.4)",
                  "fontSize": 11,
                  "fontFamily": "open-sans"
                },
                "gridLines": {
                  "zeroLineWidth": 1,
                  "zeroLineColor": "rgba(255,255,255,0.4)"
                },
                "scaleLabel": {
                  "fontColor": "rgba(255,255,255,0.4)",
                  "fontSize": 11,
                  "labelString": "°C"
                }
              },
              {
                "ticks": {
                  "fontColor": "rgba(255,255,255,0.4)",
                  "fontSize": 11,
                  "fontFamily": "open-sans"
                },
                "gridLines": {
                  "zeroLineWidth": 1,
                  "zeroLineColor": "rgba(255,255,255,0.4)"
                },
                "scaleLabel": {
                  "fontColor": "rgba(255,255,255,0.4)",
                  "fontSize": 11,
                  "labelString": "%"
                }
              }
            ],
            "xAxes": [
              {
                "ticks": {
                  "fontColor": "rgba(255,255,255,0.2)",
                  "fontSize": 10,
                  "fontFamily": "open-sans"
                },
                "gridLines": {
                  "display": false
                }
              }
            ]
          }
        }
      },
      "maand": {
        "range": "month",
        "groupBy": "week",
        "data": {
          "Temperatuur": "d.te_9",
          "Luchtvochtigheid": "d.hu_9"
        },
        "options": {
          "scales": {
            "yAxes": [
              {
                "ticks": {
                  "fontColor": "rgba(255,255,255,0.4)",
                  "fontSize": 11,
                  "fontFamily": "open-sans"
                },
                "gridLines": {
                  "zeroLineWidth": 1,
                  "zeroLineColor": "rgba(255,255,255,0.4)"
                },
                "scaleLabel": {
                  "fontColor": "rgba(255,255,255,0.4)",
                  "fontSize": 11,
                  "labelString": "°C"
                }
              },
              {
                "ticks": {
                  "fontColor": "rgba(255,255,255,0.4)",
                  "fontSize": 11,
                  "fontFamily": "open-sans"
                },
                "gridLines": {
                  "zeroLineWidth": 1,
                  "zeroLineColor": "rgba(255,255,255,0.4)"
                },
                "scaleLabel": {
                  "fontColor": "rgba(255,255,255,0.4)",
                  "fontSize": 11,
                  "labelString": "%"
                }
              }
            ],
            "xAxes": [
              {
                "ticks": {
                  "fontColor": "rgba(255,255,255,0.2)",
                  "fontSize": 10,
                  "fontFamily": "open-sans"
                },
                "gridLines": {
                  "display": false
                }
              }
            ]
          }
        }
      }
    },
    "debugButton": true,
    "displayFormats": false,
    "drawOrderDay": false,
    "drawOrderLast": false,
    "drawOrderMonth": false,
    "gradients": false,
    "graph": "line",
    "graphTypes": [
      "te",
      "hu"
    ],
    "groupBy": false,
    "height": "300px",
    "iconColour": "grey",
    "interval": 1,
    "legend": false,
    "lineFill": false,
    "lineTension": 0.3,
    "maxTicksLimit": null,
    "method": 1,
    "pointBorderColor": [
      "grey"
    ],
    "pointBorderWidth": 0,
    "pointFillColor": [
      "rgba(255, 61, 61, 0.8)",
      "rgba(50, 180, 250, 0.8)"
    ],
    "pointRadius": 0,
    "pointStyle": false,
    "reverseTime": false,
    "sortDevices": false,
    "spanGaps": false,
    "title": "Binnenklimaat",
    "toolTipStyle": false,
    "width": 12,
    "zoom": "x"
  },
  "currentValue": "18.2 C, 58 %",
  "currentValues": [
    "18.2 °C"
  ],
  "customRange": true,
  "data": {
    "result": [
      {
        "d": "2020-02-23 18:00",
        "hu_9": 31.043478260869566,
        "te_9": 10.041739130434784
      },
      {
        "d": "2020-02-23 19:00",
        "hu_9": 31.217391304347824,
        "te_9": 9.774782608695652
      },
      {
        "d": "2020-02-23 20:00",
        "hu_9": 30.26086956521739,
        "te_9": 9.781739130434783
      },
      {
        "d": "2020-02-23 21:00",
        "hu_9": 30.26086956521739,
        "te_9": 9.77826086956522
      },
      {
        "d": "2020-02-23 22:00",
        "hu_9": 30.26086956521739,
        "te_9": 9.64173913043478
      },
      {
        "d": "2020-02-23 23:00",
        "hu_9": 30.26086956521739,
        "te_9": 9.318260869565218
      },
      {
        "d": "2020-02-24 00:00",
        "hu_9": 30.26086956521739,
        "te_9": 9.04826086956522
      },
      {
        "d": "2020-02-24 01:00",
        "hu_9": 30.38095238095238,
        "te_9": 8.831904761904761
      },
      {
        "d": "2020-02-24 02:00",
        "hu_9": 31.636363636363637,
        "te_9": 9.036363636363635
      },
      {
        "d": "2020-02-24 03:00",
        "hu_9": 30.526315789473685,
        "te_9": 8.547368421052632
      },
      {
        "d": "2020-02-24 04:00",
        "hu_9": 31.23076923076923,
        "te_9": 8.475384615384614
      },
      {
        "d": "2020-02-24 05:00",
        "hu_9": 32.22222222222222,
        "te_9": 8.744444444444445
      },
      {
        "d": "2020-02-24 06:00",
        "hu_9": 30.08695652173913,
        "te_9": 8.093478260869565
      },
      {
        "d": "2020-02-24 07:00",
        "hu_9": 28.17391304347826,
        "te_9": 9.005652173913045
      },
      {
        "d": "2020-02-24 08:00",
        "hu_9": 28.17391304347826,
        "te_9": 9.350434782608694
      },
      {
        "d": "2020-02-24 09:00",
        "hu_9": 28.17391304347826,
        "te_9": 9.516521739130438
      },
      {
        "d": "2020-02-24 10:00",
        "hu_9": 28.17391304347826,
        "te_9": 9.388695652173913
      },
      {
        "d": "2020-02-24 11:00",
        "hu_9": 29.130434782608695,
        "te_9": 9.25391304347826
      },
      {
        "d": "2020-02-24 12:00",
        "hu_9": 28.52173913043478,
        "te_9": 9.573913043478262
      },
      {
        "d": "2020-02-24 13:00",
        "hu_9": 28.434782608695652,
        "te_9": 9.786521739130436
      },
      {
        "d": "2020-02-24 14:00",
        "hu_9": 29.217391304347824,
        "te_9": 9.54782608695652
      },
      {
        "d": "2020-02-24 15:00",
        "hu_9": 29.565217391304348,
        "te_9": 9.516521739130436
      },
      {
        "d": "2020-02-24 16:00",
        "hu_9": 30.26086956521739,
        "te_9": 9.527826086956523
      }
    ],
    "status": "OK",
    "title": "Graph day",
    "Temperatuur": "d.te_9",
    "Luchtvochtigheid": "d.hu_9"
  },
  "dataFilterCount": 24,
  "dataFilterUnit": "hours",
  "decimals": 1,
  "forced": false,
  "graphConfig": {
    "range": "day",
    "groupBy": "hour",
    "filter": "24 hours",
    "data": {
      "Temperatuur": "d.te_9",
      "Luchtvochtigheid": "d.hu_9"
    }
  },
  "graphIdx": "block_69",
  "hasBlock": true,
  "idx": 9,
  "lastRefreshTime": 1582560634,
  "mountPoint": "#block_6",
  "multigraph": false,
  "name": "Binnenklimaat",
  "popup": false,
  "primary": true,
  "primaryIdx": "block_69",
  "range": "day",
  "realrange": "day",
  "sensor": "temp",
  "subtype": "WTGR800",
  "title": "Binnenklimaat",
  "txtUnit": "°C",
  "type": "Temp + Humidity",
  "isInitial": true,
  "groupBy": "hour",
  "keys": [
    "hu",
    "te"
  ],
  "ykeys": [
    "Temperatuur",
    "Luchtvochtigheid"
  ],
  "ylabels": [
    "%",
    "°C"
  ],
  "filter": "24 hours"
}
Mario ipsum RGB mushroom 1-up.
- clinkadink
- Posts: 417
- Joined: Tuesday 31 December 2019 1:15
- Target OS: Linux
- Domoticz version: 2020.2
- Location: Swindon, UK
- Contact:
Re: Multiple sources in one graph
Thanks for the quick response. I have found the issue and will correct it this evening.
"UI is the saddle, the stirrups, & the reins. UX is the feeling you get being able to ride the horse."
- Sjonnie2017
- Posts: 372
- Joined: Wednesday 02 August 2017 19:43
- Target OS: Linux
- Domoticz version: Latest ß
- Location: The Netherlands
- Contact:
Re: Multiple sources in one graph
Hi,
I am having trouble to get the custom popup showing. I tried my own notation (rem'ed out in below sample) and your anotation style. In both cases I am unable to get the popup graph to show up when I click the block "Elektra Nu".
I have replaced my custom.css by a backup version.
Definition of my variables:
The attempt to get the popup to show
Any tips?
Greetz,
Sjonnie
I am having trouble to get the custom popup showing. I tried my own notation (rem'ed out in below sample) and your anotation style. In both cases I am unable to get the popup graph to show up when I click the block "Elektra Nu".
I have replaced my custom.css by a backup version.
Definition of my variables:
Code: Select all
// Gas en elektra
var elektra                    = 199;
var gas                        = 200;
var elektra_nu                 = '199_1';
var elektra_vandaag            = '199_2';
var elektra_totaal             = '199_3';
var grafiek_gas                = 'graph_200';
var grafiek_elektra            = 'graph_199';
Code: Select all
// componenten gas en elektra
//blocks[elektra_nu] = {}
//blocks[elektra_nu]['width'] = 4;
//blocks[elektra_nu]['popup'] = 'popup_elektra_nu';
//blocks[elektra_nu]['show_lastupdate'] = false;
//blocks[elektra_nu]['protected'] = true;

blocks[elektra_nu] = {
	width: 4,
	popup: 'popup_elektra_nu',
	show_lastupdate: false,
}

//blocks['popup_elektra_nu'] = {}
//blocks['popup_ekektra_nu']['title'] = 'Electriciteit';
//blocks['popup_elektra_nu']['devices'] = [199];
//blocks['popup_elektra_nu']['toolTipStyle'] = true;
//blocks['popup_elektra_nu']['datasetColors'] = ['red', 'yellow'];
//blocks['popup_elektra_nu']['graph'] = 'line';
//blocks['popup_elektra_nu']['legend'] = {'v2_199': 'Dag', 'v_199': 'Nacht'}

blocks['popup_elektra_nu'] = {
    title: 'Electriciteit',
    devices: [199],
    toolTipStyle: true,
    datasetColors: ['red', 'yellow'],
    graph: 'line',
    legend: {
        'v_199' : 'Nacht',
        'v2_199': 'Dag',
        'c_199' : 'Totaal'
    }
}Greetz,
Sjonnie
ConBee II - TRÅDFRI lights + switches, loads of ChingLing dimmers and switches, Heiman and Xiaomi sensors
SolarEdge SE4000H (with active modbus_tcp)
YouLess Energy meter
Shelly 2.5 in roller shutter mode
SolarEdge SE4000H (with active modbus_tcp)
YouLess Energy meter
Shelly 2.5 in roller shutter mode
- clinkadink
- Posts: 417
- Joined: Tuesday 31 December 2019 1:15
- Target OS: Linux
- Domoticz version: 2020.2
- Location: Swindon, UK
- Contact:
Re: Multiple sources in one graph
Did you remove your CSS tooltip styling from the last update? What happens when you click the block? Does any popup show? What happens when you add the popup graph to your column definition? Does it display correctly as a standard graph?Sjonnie2017 wrote: Monday 24 February 2020 19:19 I am having trouble to get the custom popup showing.
"UI is the saddle, the stirrups, & the reins. UX is the feeling you get being able to ride the horse."
- clinkadink
- Posts: 417
- Joined: Tuesday 31 December 2019 1:15
- Target OS: Linux
- Domoticz version: 2020.2
- Location: Swindon, UK
- Contact:
Re: Multiple sources in one graph
Please try this.Sjonnie2017 wrote: Monday 24 February 2020 19:19 I am having trouble to get the custom popup showing. I tried my own notation (rem'ed out in below sample) and your anotation style. In both cases I am unable to get the popup graph to show up when I click the block "Elektra Nu".
- Spoiler: show
"UI is the saddle, the stirrups, & the reins. UX is the feeling you get being able to ride the horse."
- Sjonnie2017
- Posts: 372
- Joined: Wednesday 02 August 2017 19:43
- Target OS: Linux
- Domoticz version: Latest ß
- Location: The Netherlands
- Contact:
Re: Multiple sources in one graph
Hi,
Thanks for your reply and suggestion. It lead to some unexpected results
Note that I have an empty custom.css so that should not be the problem.
Bit stumped here...
Unexpected result on the dashboard:
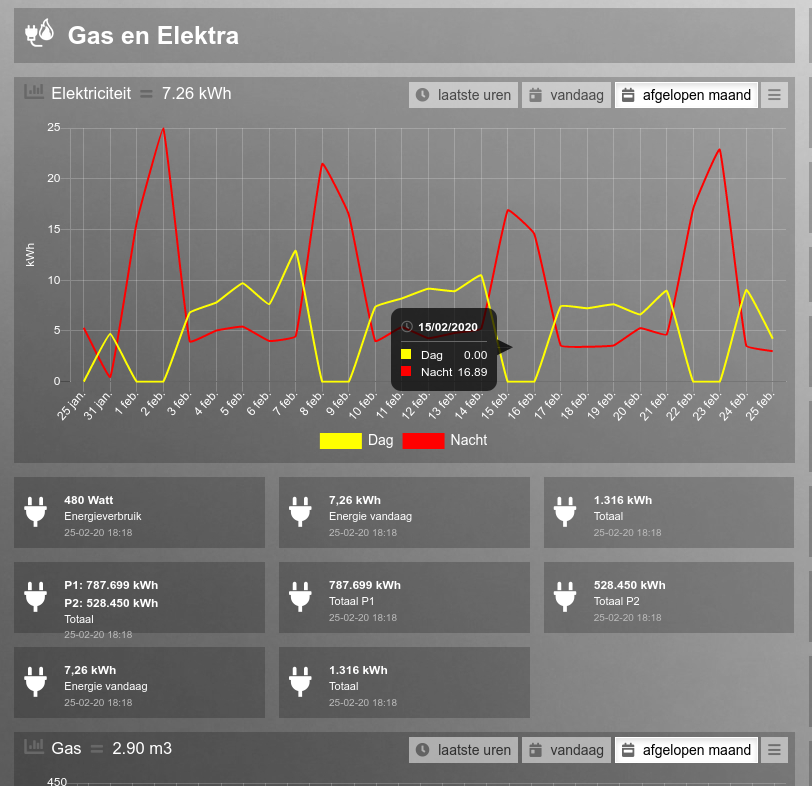
A popup graph for the color blind :
:
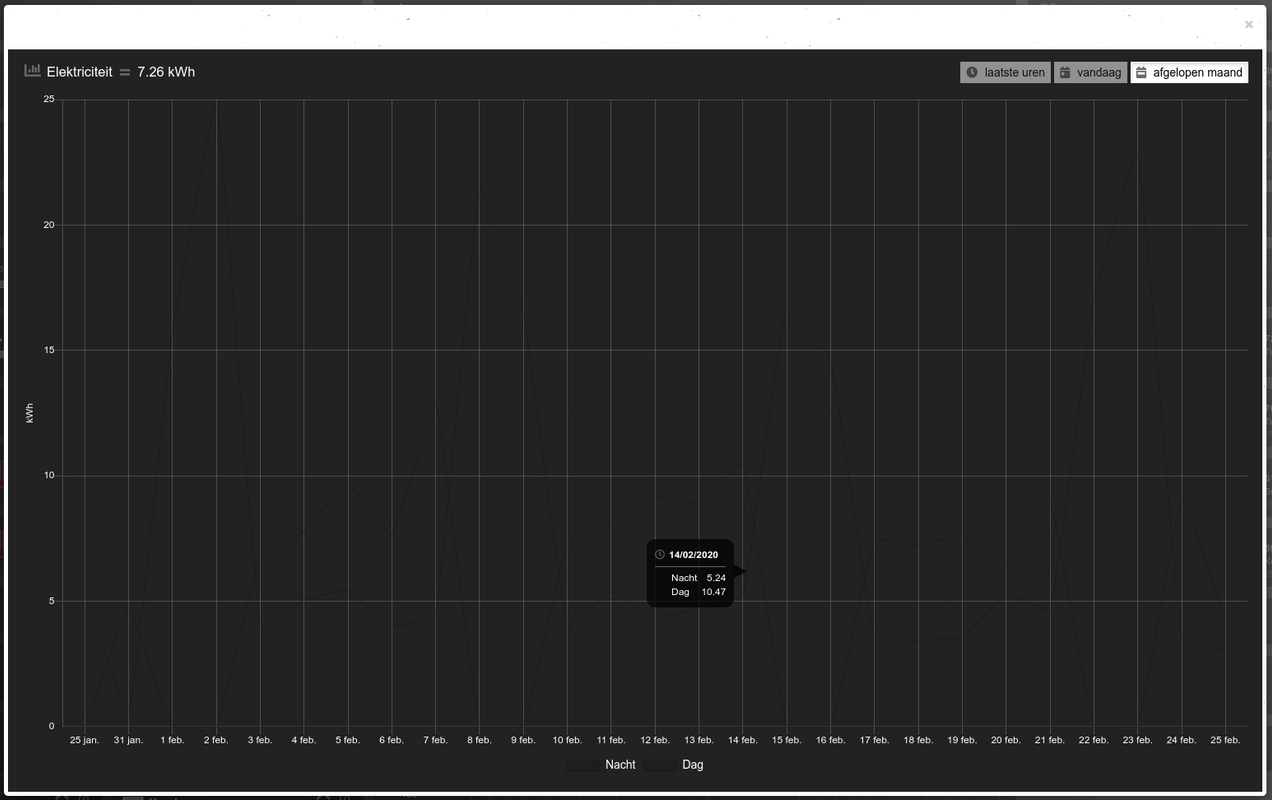
Definition of the blocks:
Definition of column 2:
Greetz,
Sjonnie
EDIT: Changing 199 to '199_1' in the block definition and the columns caused the previous behavior (as one expected).
Thanks for your reply and suggestion. It lead to some unexpected results
Note that I have an empty custom.css so that should not be the problem.
Bit stumped here...
Unexpected result on the dashboard:

A popup graph for the color blind

Definition of the blocks:
Code: Select all
blocks[199] = {
	width: 4,
	popup: 'popup_elektra_nu',
	//show_lastupdate: false,
}

//blocks['popup_elektra_nu'] = {}
//blocks['popup_ekektra_nu']['title'] = 'Electriciteit';
//blocks['popup_elektra_nu']['devices'] = [199];
//blocks['popup_elektra_nu']['toolTipStyle'] = true;
//blocks['popup_elektra_nu']['datasetColors'] = ['red', 'yellow'];
//blocks['popup_elektra_nu']['graph'] = 'line';
//blocks['popup_elektra_nu']['legend'] = {'v2_199': 'Dag', 'v_199': 'Nacht'}

blocks['popup_elektra_nu'] = {
    title: 'Elektriciteit',
    devices: [199],
    toolTipStyle: true,
    datasetColors: ['red', 'yellow', 'blue'],
    graph: 'line',
    legend: {
        'v_199' : 'Nacht',
        'v2_199': 'Dag',
        'c_199' : 'Totaal'
    }
}Code: Select all
columns[2] = {}
columns[2]['blocks'] = [title_gas_en_elektra, grafiek_elektra, 199, elektra_vandaag, elektra_totaal, grafiek_gas, gas]
columns[2]['width'] = 5;Sjonnie
EDIT: Changing 199 to '199_1' in the block definition and the columns caused the previous behavior (as one expected).
ConBee II - TRÅDFRI lights + switches, loads of ChingLing dimmers and switches, Heiman and Xiaomi sensors
SolarEdge SE4000H (with active modbus_tcp)
YouLess Energy meter
Shelly 2.5 in roller shutter mode
SolarEdge SE4000H (with active modbus_tcp)
YouLess Energy meter
Shelly 2.5 in roller shutter mode
- clinkadink
- Posts: 417
- Joined: Tuesday 31 December 2019 1:15
- Target OS: Linux
- Domoticz version: 2020.2
- Location: Swindon, UK
- Contact:
Re: Multiple sources in one graph
The popup is showing the correct graph, but the dataset had no color assigned. I am guessing that your keys change for "month". Disable the defined popup, check the keys for month, update your defined popup blocks legend and dataset colors accordingly.
"UI is the saddle, the stirrups, & the reins. UX is the feeling you get being able to ride the horse."
- Sjonnie2017
- Posts: 372
- Joined: Wednesday 02 August 2017 19:43
- Target OS: Linux
- Domoticz version: Latest ß
- Location: The Netherlands
- Contact:
Re: Multiple sources in one graph
Ok, that works. I changed the dataset colors as follows:
which leads to:
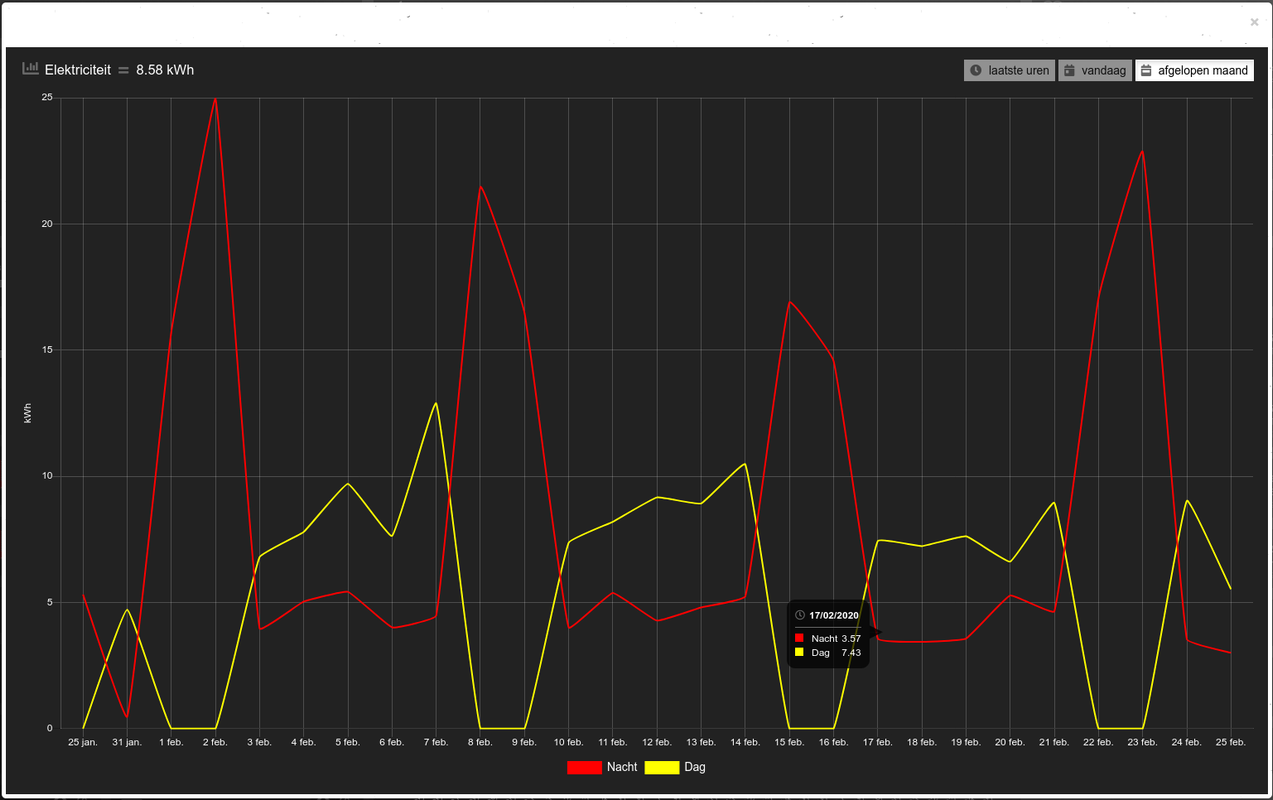
Now all I have to figure out is how to get my blocks beneath the graph to show up the way I want it... To be continued
Greetz,
Sjonnie
Code: Select all
blocks['popup_elektra_nu'] = {
    title: 'Elektriciteit',
    devices: [199],
    toolTipStyle: true,
    //datasetColors: ['red', 'yellow', 'blue', 'green', 'white', 'orange'],
    datasetColors: ['red', 'yellow', 'blue', 'red', 'yellow', 'aqua', 'red', 'yellow'],
    graph: 'line',
    legend: {
        'v_199' : 'Nacht',
        'v2_199': 'Dag',
        'c_199' : 'Totaal'
    }
}

Now all I have to figure out is how to get my blocks beneath the graph to show up the way I want it... To be continued
Greetz,
Sjonnie
ConBee II - TRÅDFRI lights + switches, loads of ChingLing dimmers and switches, Heiman and Xiaomi sensors
SolarEdge SE4000H (with active modbus_tcp)
YouLess Energy meter
Shelly 2.5 in roller shutter mode
SolarEdge SE4000H (with active modbus_tcp)
YouLess Energy meter
Shelly 2.5 in roller shutter mode
- flemm
- Posts: 25
- Joined: Thursday 20 February 2020 8:04
- Target OS: Raspberry Pi / ODroid
- Domoticz version: 4.11780
- Location: Netherlands
- Contact:
Re: Multiple sources in one graph
clinkadink wrote: Monday 24 February 2020 17:49 Thanks for the quick response. I have found the issue and will correct it this evening.
Works like a charm now, thanks a million!
Mario ipsum RGB mushroom 1-up.
- clinkadink
- Posts: 417
- Joined: Tuesday 31 December 2019 1:15
- Target OS: Linux
- Domoticz version: 2020.2
- Location: Swindon, UK
- Contact:
Re: Multiple sources in one graph
Glad you got it workingSjonnie2017 wrote: Tuesday 25 February 2020 19:54 Ok, that works. I changed the dataset colors as follows:
Great news! Thanks for letting me know
"UI is the saddle, the stirrups, & the reins. UX is the feeling you get being able to ride the horse."
- Sjonnie2017
- Posts: 372
- Joined: Wednesday 02 August 2017 19:43
- Target OS: Linux
- Domoticz version: Latest ß
- Location: The Netherlands
- Contact:
Re: Multiple sources in one graph
OK, added a lot of popup graphs and tried to deduce why I could not get my electricity popup graphs to show up when clicking on my blocks. It is not caused by my "strange" syntax for the blocks. I think it is caused by the fact that the block refers to IDX 199_1 (for example) and the popup graph uses IDX 199. Could this be the case/cause?
Greetz,
Sjonnie
Greetz,
Sjonnie
ConBee II - TRÅDFRI lights + switches, loads of ChingLing dimmers and switches, Heiman and Xiaomi sensors
SolarEdge SE4000H (with active modbus_tcp)
YouLess Energy meter
Shelly 2.5 in roller shutter mode
SolarEdge SE4000H (with active modbus_tcp)
YouLess Energy meter
Shelly 2.5 in roller shutter mode
- clinkadink
- Posts: 417
- Joined: Tuesday 31 December 2019 1:15
- Target OS: Linux
- Domoticz version: 2020.2
- Location: Swindon, UK
- Contact:
Re: Multiple sources in one graph
Yes, and that is why I changed it to 199 in my example that I providedSjonnie2017 wrote: Wednesday 26 February 2020 19:29 I think it is caused by the fact that the block refers to IDX 199_1 (for example) and the popup graph uses IDX 199. Could this be the case/cause?
"UI is the saddle, the stirrups, & the reins. UX is the feeling you get being able to ride the horse."
- flemm
- Posts: 25
- Joined: Thursday 20 February 2020 8:04
- Target OS: Raspberry Pi / ODroid
- Domoticz version: 4.11780
- Location: Netherlands
- Contact:
Re: Multiple sources in one graph
Since the update i git-pulled this morning, my custom axis label colours and gridline options stopped working. Has something changed in how to define 'options' variables? I'll attach my graph definition. And yes, i know this is not very dry code, but i couldn't find a better way to make it work.. Any suggestions are more than welome 
Code: Select all
blocks['graph_9'] = {
  devices: [45,46],
  width: 12,
  zoom: 'x',
  title: 'Binnenklimaat',
  graph: 'line',
  datasetColors: ['rgba(255, 61, 61, 0.8)','rgba(50, 180, 250, 0.8)'],
  borderWidth: 2,
  lineTension: 0.3,
  graphTypes: ['te', 'hu'],
  legend: {
    'te': 'Temperatuur',
    'hu': 'Luchtvochtigheid',
  },
  legend: false,
  buttonsSize: 10,
  custom : {
    "vandaag": {
			range: 'day',
			groupBy: 'hour',
			filter: '12 hours',
      data: {
        Temperatuur: 'd.te_45',
        Luchtvochtigheid: 'd.hu_46',
      },
      options: {
        scales: {
          yAxes: [{
            ticks: {
              min: 10,
              max: 20,
              stepSize: 2,
              fontColor: "rgba(128,128,128,0.4)",
              fontSize: 10,
              fontFamily: 'open-sans',
            },
              gridLines: {
                zeroLineColor: "rgba(128,128,128,0.3)",
								color: "rgba(128,128,128,0.3)",
              },
              scaleLabel: {
                fontColor: "rgba(128,128,128,0.3)",
                fontSize: 11,
                labelString:'°C'
              },
          },
					{
						ticks: {
							min: 50,
							max: 60,
							stepSize: 2,
							fontColor: "rgba(128,128,128,0.4)",
							fontSize: 10,
							fontFamily: 'open-sans',
						},
							gridLines: {
								zeroLineWidth: 1,
                zeroLineColor: "rgba(128,128,128,0.3)",
								color: "rgba(0,0,0,0)",
							},
							scaleLabel: {
								fontColor: "rgba(128,128,128,0.4)",
								fontSize: 11,
								labelString:'%'
							},
					}],
          xAxes: [{
            ticks: {
              fontColor: "rgba(128,128,128,0.4)",
              fontSize: 10,
              fontFamily: 'open-sans',
            },
            gridLines: {
              display: false,
            },
          }]
        }
      },
    },
    "week": {
			range: 'month',
			groupBy: 'day',
			filter: '7 days',
        data: {
					Temperatuur: 'd.te_45',
	        Luchtvochtigheid: 'd.hu_46',
        },
				options: {
	        scales: {
	          yAxes: [{
	            ticks: {
								min: 10,
	              max: 20,
	              stepSize: 2,
	              fontColor: "rgba(128,128,128,0.4)",
	              fontSize: 11,
	              fontFamily: 'open-sans',
	            },
	              gridLines: {
	                zeroLineWidth: 1,
	                zeroLineColor: "rgba(128,128,128,0.4)",
	              },
	              scaleLabel: {
	                fontColor: "rgba(128,128,128,0.4)",
	                fontSize: 11,
	                labelString:'°C'
	              },
	          },
						{
							ticks: {
								min: 50,
								max: 60,
								stepSize: 2,
								fontColor: "rgba(128,128,128,0.4)",
								fontSize: 11,
								fontFamily: 'open-sans',
							},
								gridLines: {
									zeroLineWidth: 1,
									zeroLineColor: "rgba(128,128,128,0.4)",
								},
								scaleLabel: {
									fontColor: "rgba(128,128,128,0.4)",
									fontSize: 11,
									labelString:'%'
								},
						}],
	          xAxes: [{
	            ticks: {
	              fontColor: "rgba(128,128,128,0.4)",
	              fontSize: 10,
	              fontFamily: 'open-sans',
	            },
	            gridLines: {
	              display: false,
	            },
	          }]
	        }
	      },
    },
    "maand": {
			range: 'month',
			groupBy: 'week',
        data: {
					Temperatuur: 'd.te_45',
	        Luchtvochtigheid: 'd.hu_46',
        },
				options: {
	        scales: {
	          yAxes: [{
	            ticks: {
								min: 10,
	              max: 20,
	              stepSize: 2,
	              fontColor: "rgba(128,128,128,0.4)",
	              fontSize: 11,
	              fontFamily: 'open-sans',
	            },
	              gridLines: {
	                zeroLineWidth: 1,
	                zeroLineColor: "rgba(128,128,128,0.4)",
	              },
	              scaleLabel: {
	                fontColor: "rgba(128,128,128,0.4)",
	                fontSize: 11,
	                labelString:'°C'
	              },
	          },
						{
							ticks: {
								min: 50,
								max: 60,
								stepSize: 2,
								fontColor: "rgba(128,128,128,0.4)",
								fontSize: 11,
								fontFamily: 'open-sans',
							},
								gridLines: {
									zeroLineWidth: 1,
									zeroLineColor: "rgba(128,128,128,0.4)",
								},
								scaleLabel: {
									fontColor: "rgba(128,128,128,0.4)",
									fontSize: 11,
									labelString:'%'
								},
						}],
	          xAxes: [{
	            ticks: {
	              fontColor: "rgba(128,128,128,0.4)",
	              fontSize: 10,
	              fontFamily: 'open-sans',
	            },
	            gridLines: {
	              display: false,
	            },
	          }]
	        }
	      },
      }
  }
}
Mario ipsum RGB mushroom 1-up.
- Sjonnie2017
- Posts: 372
- Joined: Wednesday 02 August 2017 19:43
- Target OS: Linux
- Domoticz version: Latest ß
- Location: The Netherlands
- Contact:
Re: Multiple sources in one graph
OK, and do you think that can be solved? Would it be possible in the future to add a popup graph to an arbitrary block? I would hate you to become boredclinkadink wrote: Wednesday 26 February 2020 19:33 Yes, and that is why I changed it to 199 in my example that I provided
Greetz,
Sjonnie
ConBee II - TRÅDFRI lights + switches, loads of ChingLing dimmers and switches, Heiman and Xiaomi sensors
SolarEdge SE4000H (with active modbus_tcp)
YouLess Energy meter
Shelly 2.5 in roller shutter mode
SolarEdge SE4000H (with active modbus_tcp)
YouLess Energy meter
Shelly 2.5 in roller shutter mode
Who is online
Users browsing this forum: No registered users and 1 guest