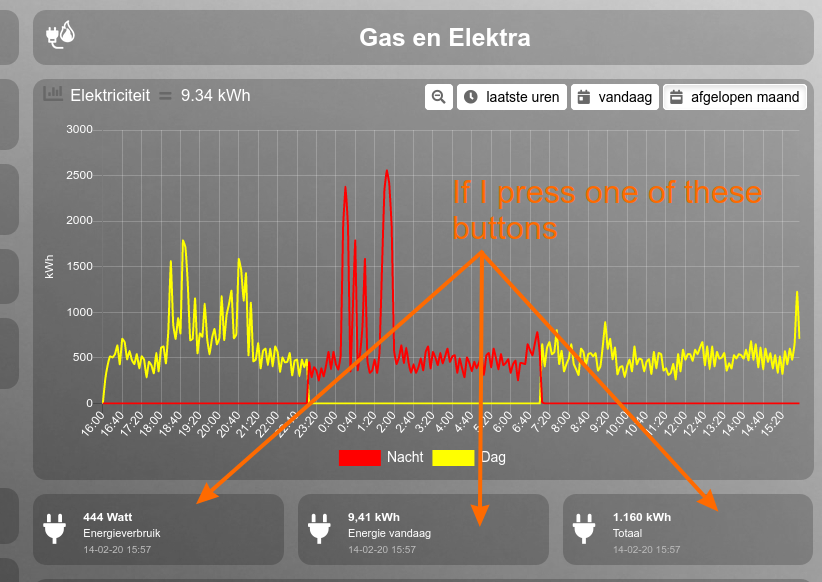
I have a number of buttons (blocks) beneath my electricity graph. If I press on of the buttons I get another graph than the one I defined in my config.js. Would be nice if they were the same graphs
Greetz,
Sjonnie
Moderators: leecollings, htilburgs, robgeerts

Yes, understood. Please can you log this as a "Feature Request" with title "Graph - Sort Legend"? Otherwise this may "get lost the post".Sjonnie2017 wrote: Friday 14 February 2020 15:49 The order of the legend is not a big issue. It's a "nice to have". I think focusing on the height issue is indeed more important.
Ha, no. Like you, I am a Dashticz user, who likes graphsSjonnie2017 wrote: Friday 14 February 2020 15:49 I am not sure if you are now the "lead developer" of the graphs in Dashticz. But if so I would like to propose something for the "roadmap" if I may?
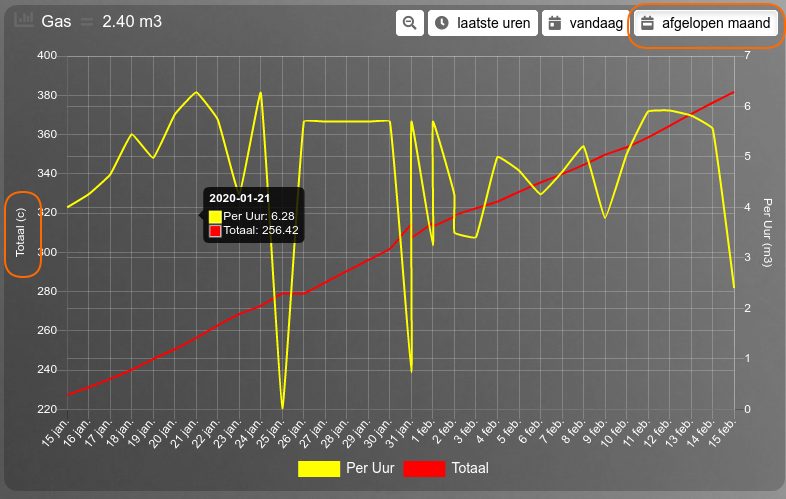
I know what you mean. It sounds like it can be achieved. Please can you log this as a "Feature Request" with title "Graph - Custom Header"?Sjonnie2017 wrote: Friday 14 February 2020 15:49 The graph for Electricity is showing the total usage of the current day in the header where the graph for Gas shows me the total usage of all time in the header. Would be a "nice to have" (also) if this was configurable. See my numerous screenshots for examples
This is only because in your main graph, you have a block defined with graphTypes limiting the data that is displayed. Popups are dynamically generated, and would not be able to limit the data. I.e. it will show all keys, which obviously changes the appearance, scale, amount of Y axes, of your popup.Sjonnie2017 wrote: Friday 14 February 2020 16:07 I have a number of buttons (blocks) beneath my electricity graph. If I press on of the buttons I get another graph than the one I defined in my config.js. Would be nice if they were the same graphs
Code: Select all
height: '300px',Code: Select all
legend: {
   'te_72': 'Inside',
   'te_6': 'Outside'
}No needSjonnie2017 wrote: Friday 14 February 2020 17:55 Will add the feature request tomorrow. Thanks for the tip (and your support of course... but that's obvious)
And I thought I had too much time on my hands yesterdayclinkadink wrote: Friday 14 February 2020 23:30No needSjonnie2017 wrote: Friday 14 February 2020 17:55 Will add the feature request tomorrow. Thanks for the tip (and your support of course... but that's obvious
Thanks for testing this and the detailed feedbackSjonnie2017 wrote: Saturday 15 February 2020 13:15
- the multigraphs work like a charm!
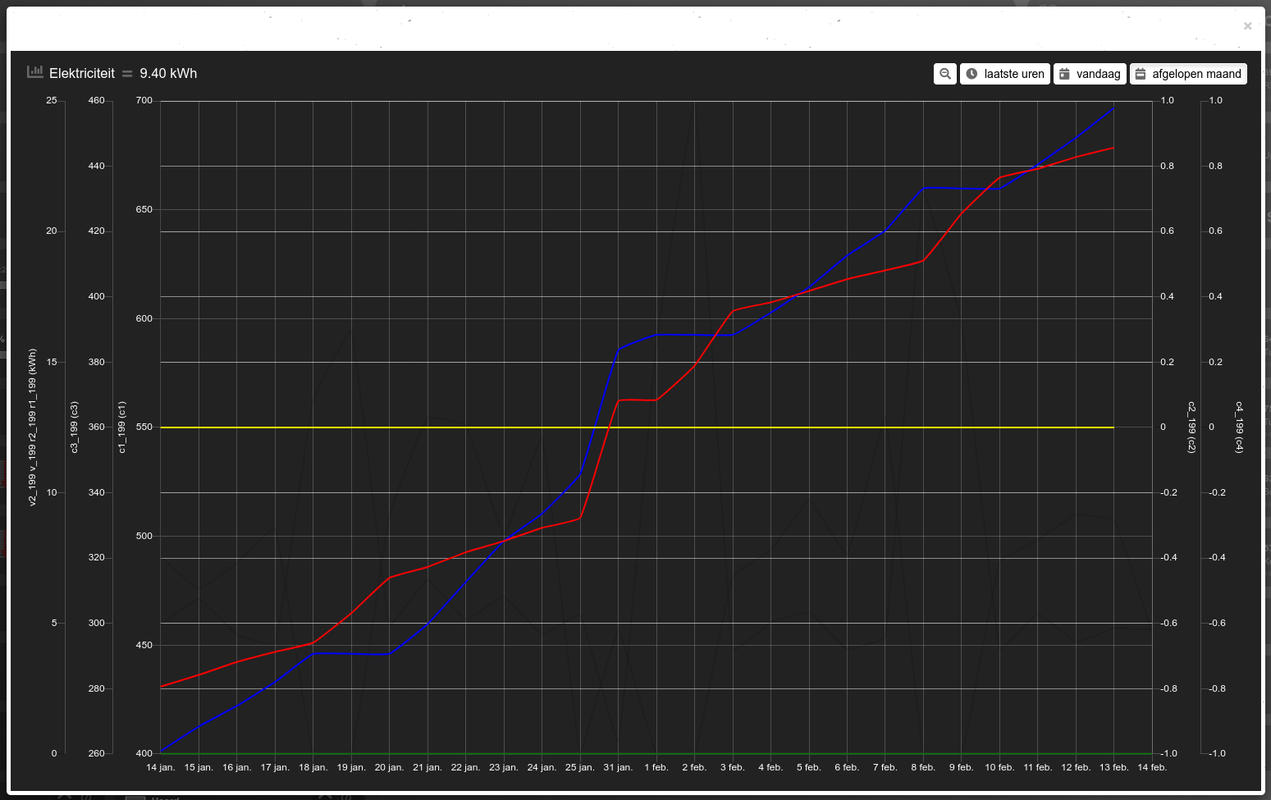
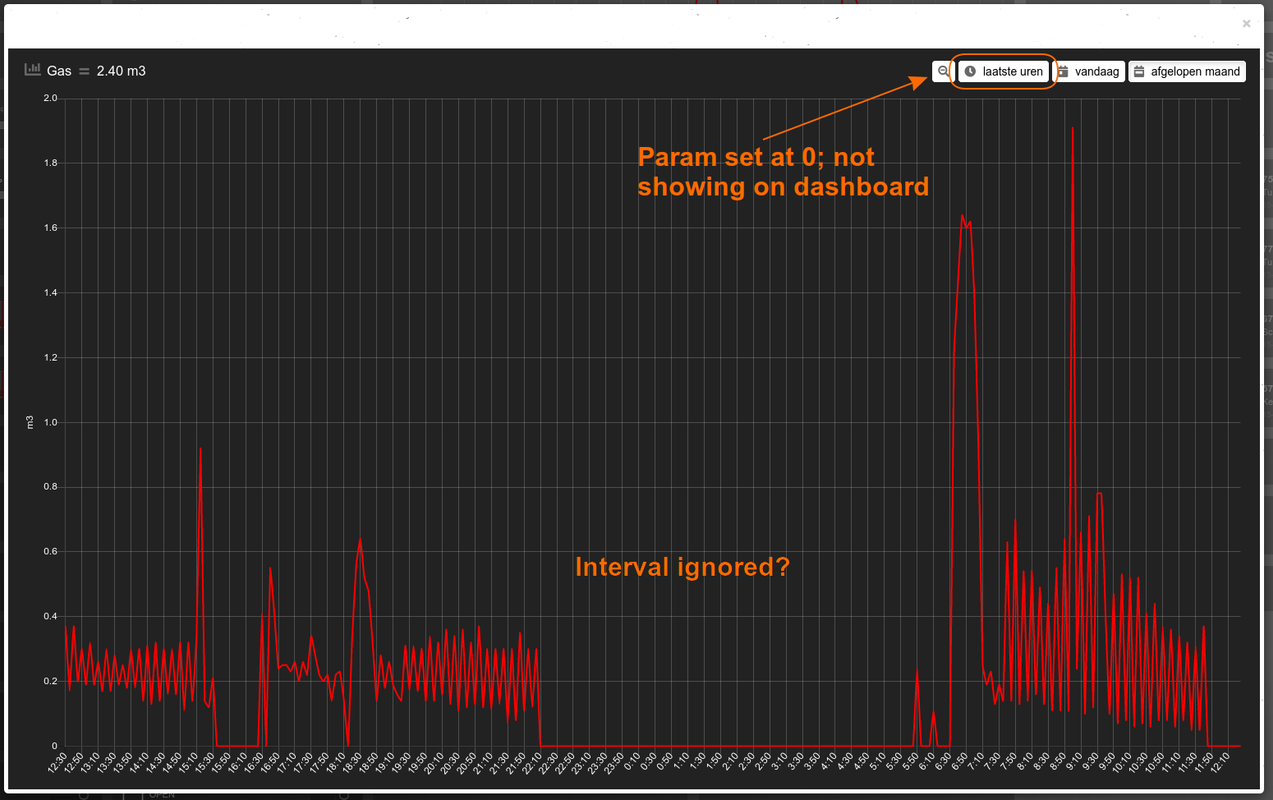
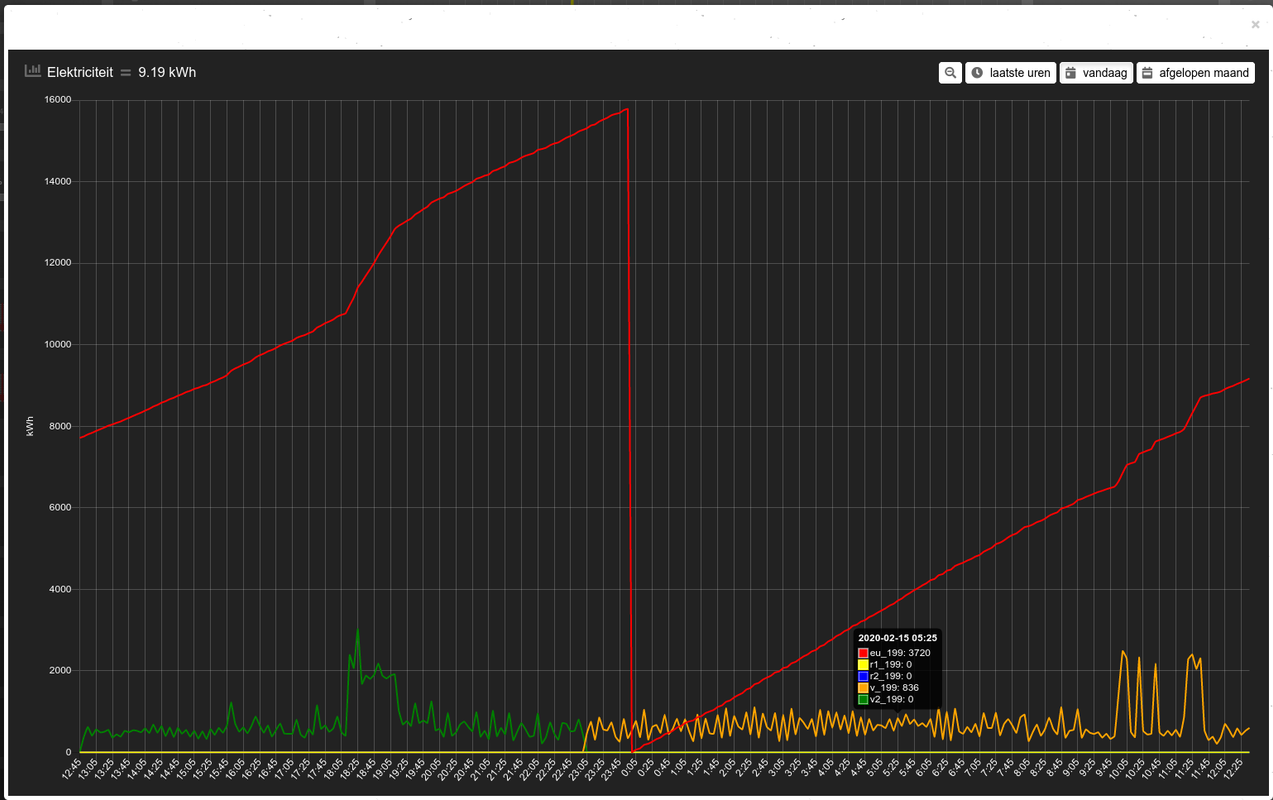
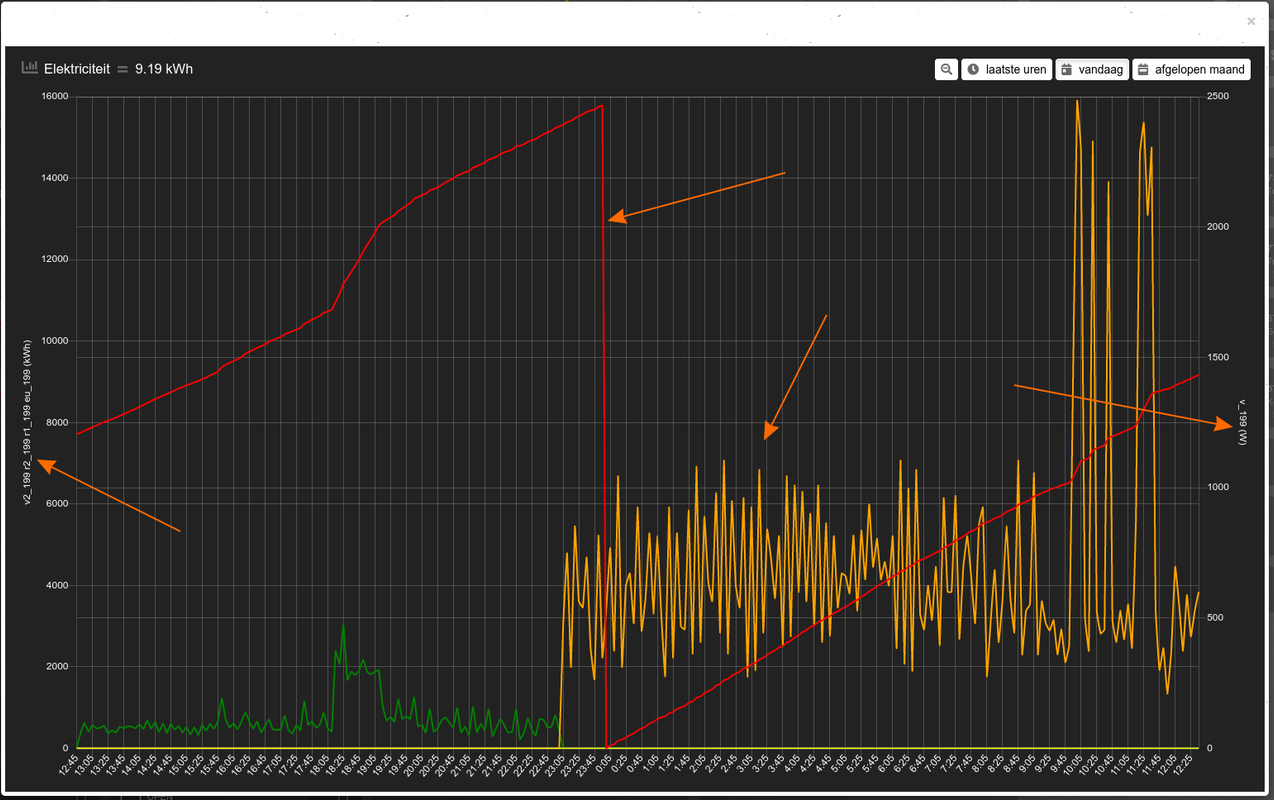
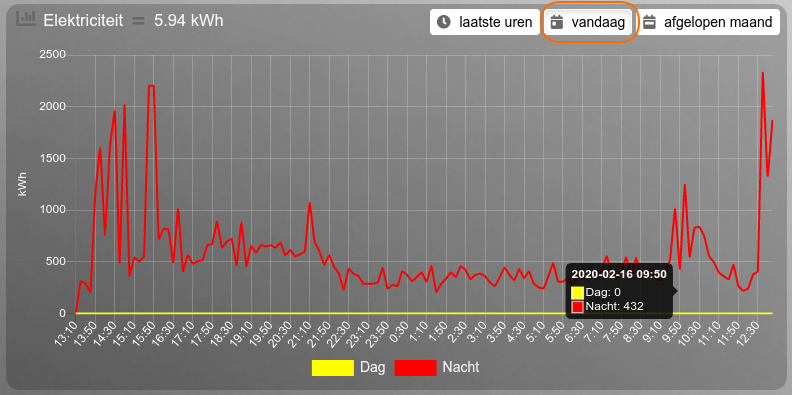
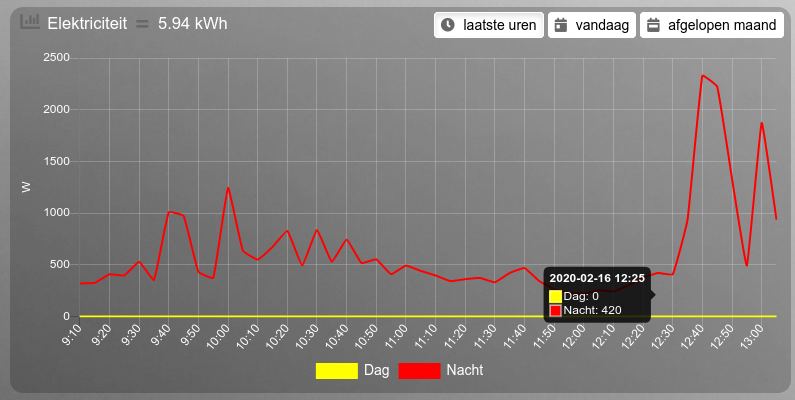
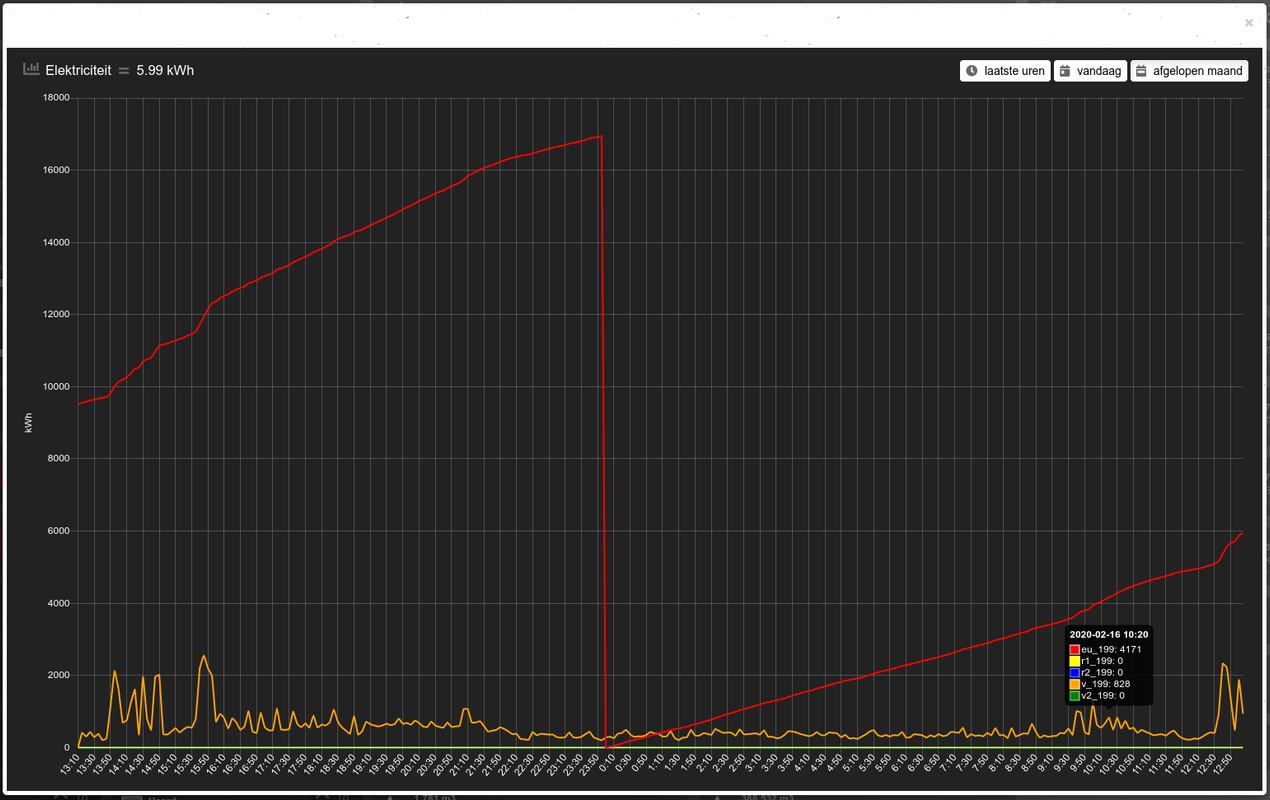
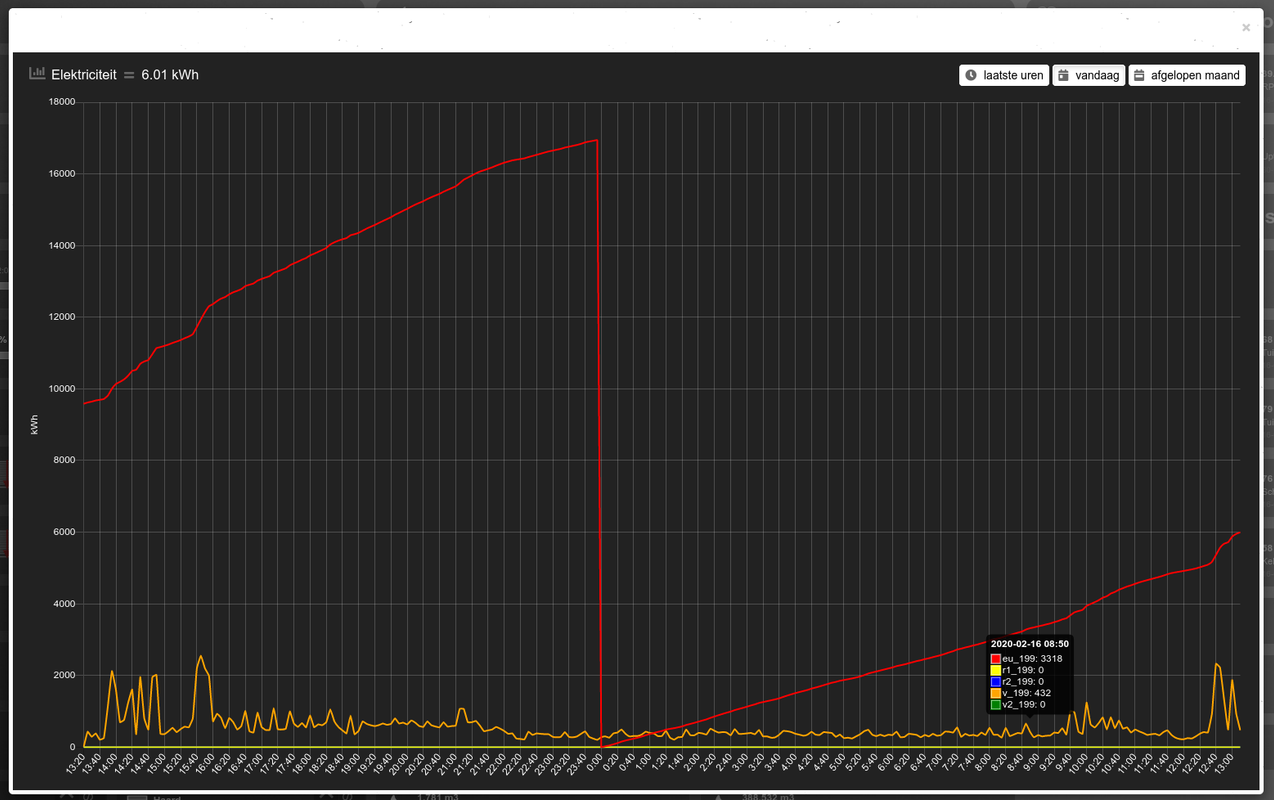
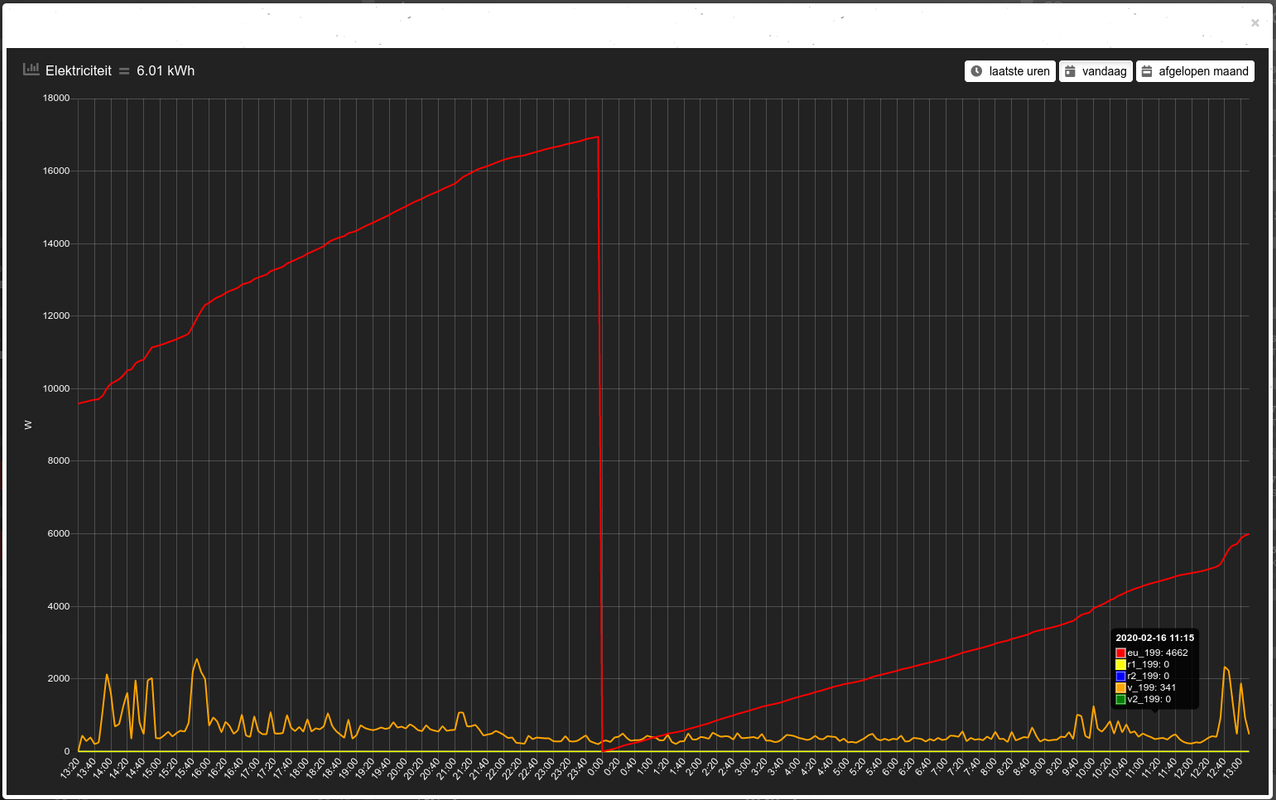
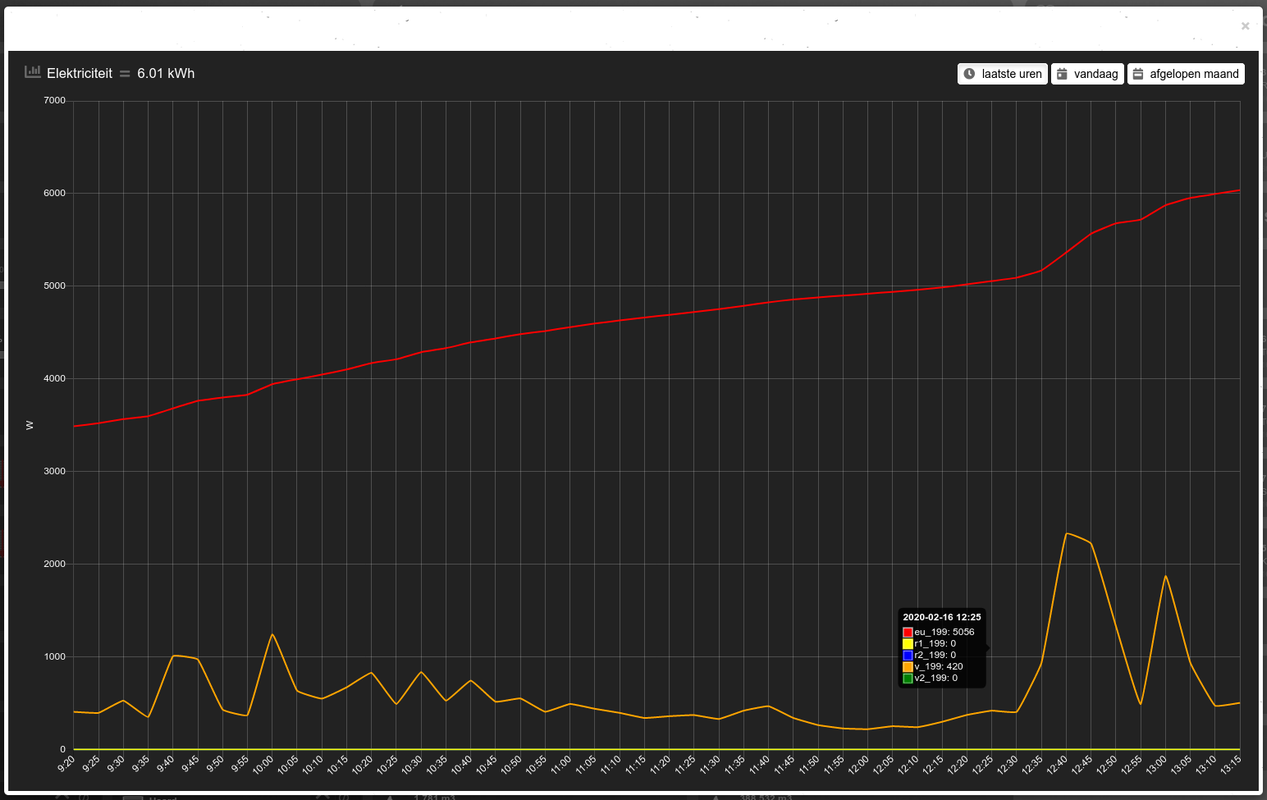
- the popup graphs seem to ignore some parameters (like interval) and seem to render differently if I select a period (like today) more than once in the same session/popup. If I close the popup and open it again I get the same behavior. I hope I can clarify with some screenshots.
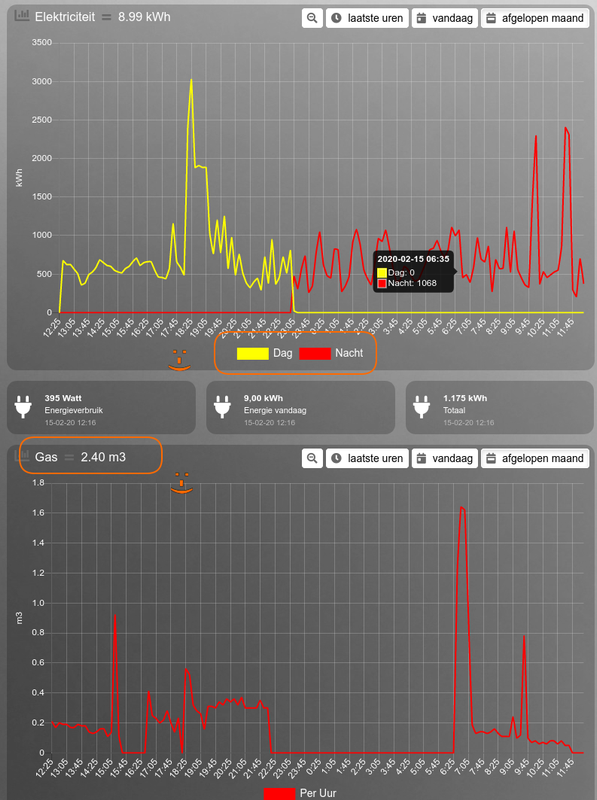
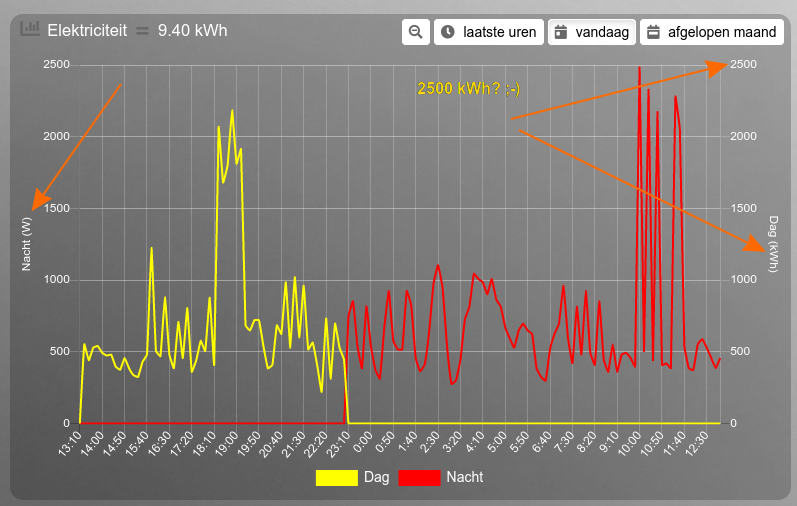
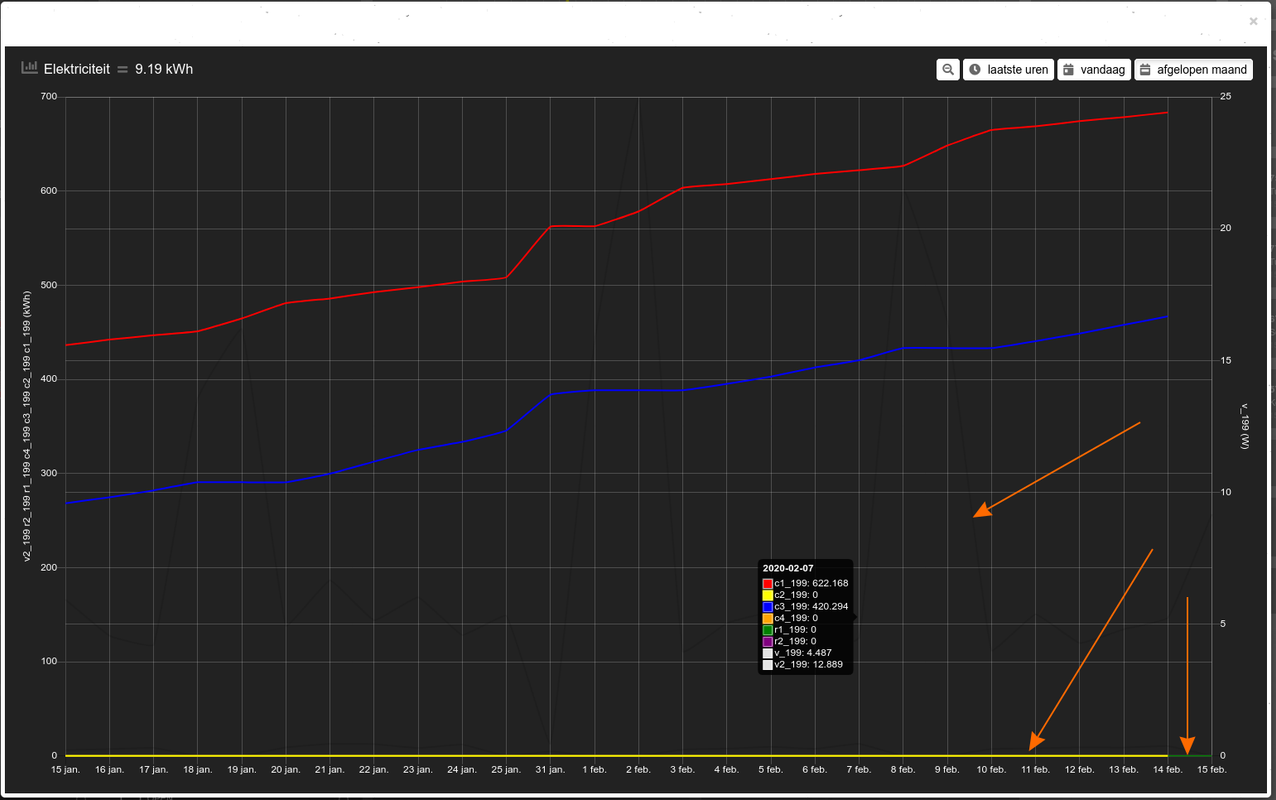
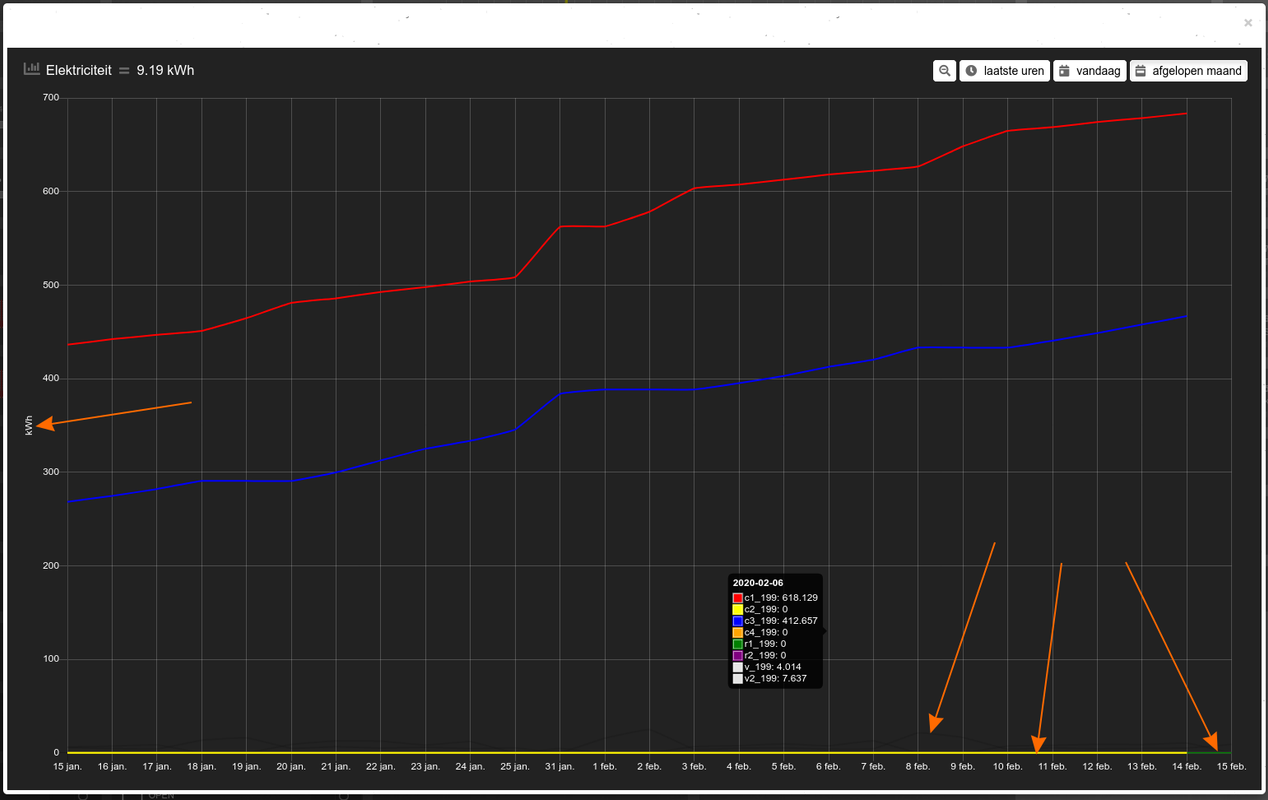
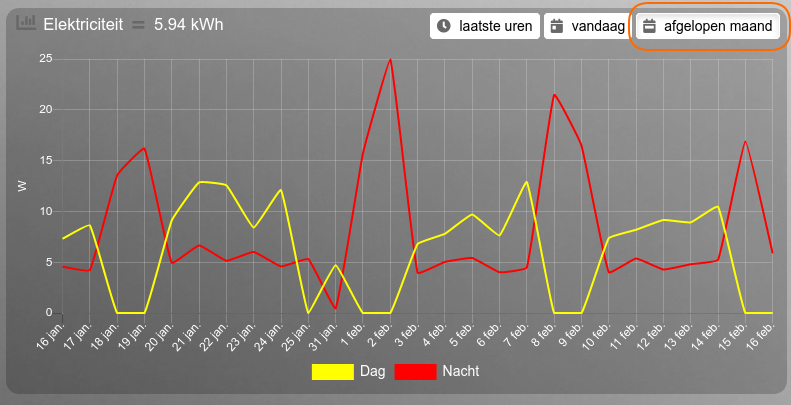
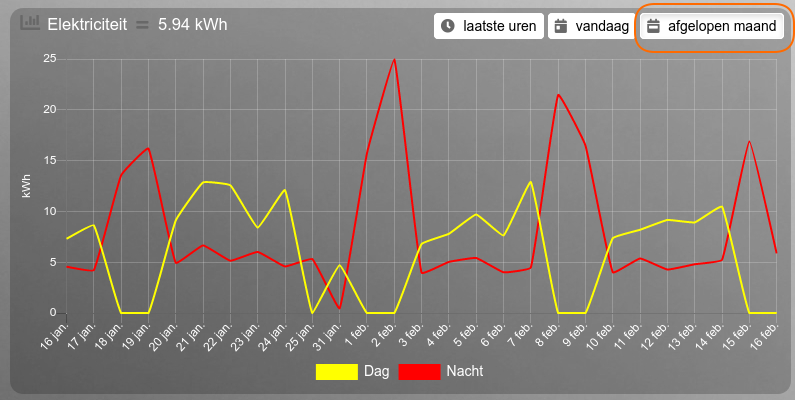
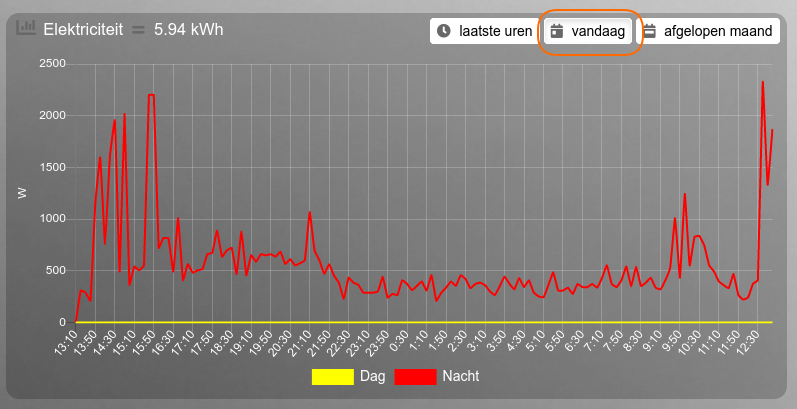
- the graphs do not always show the right unit of measurement; see pictures
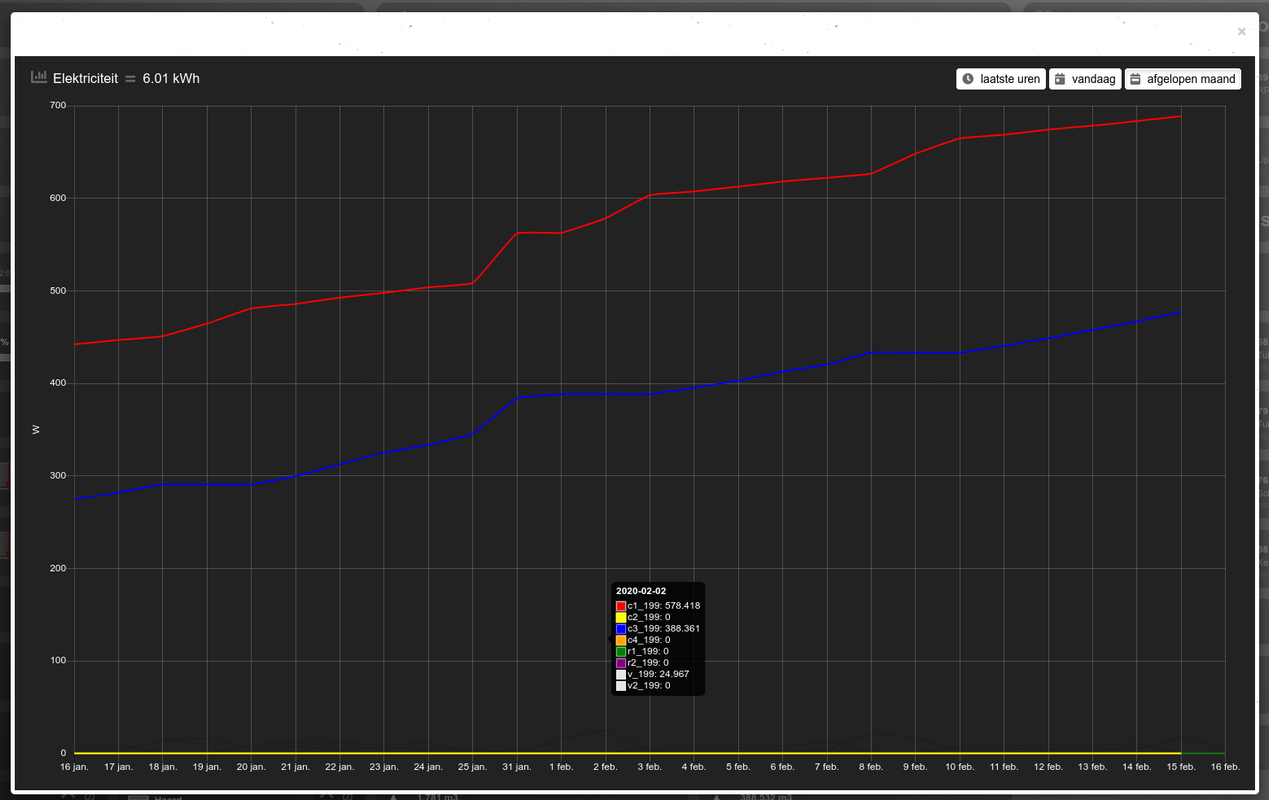
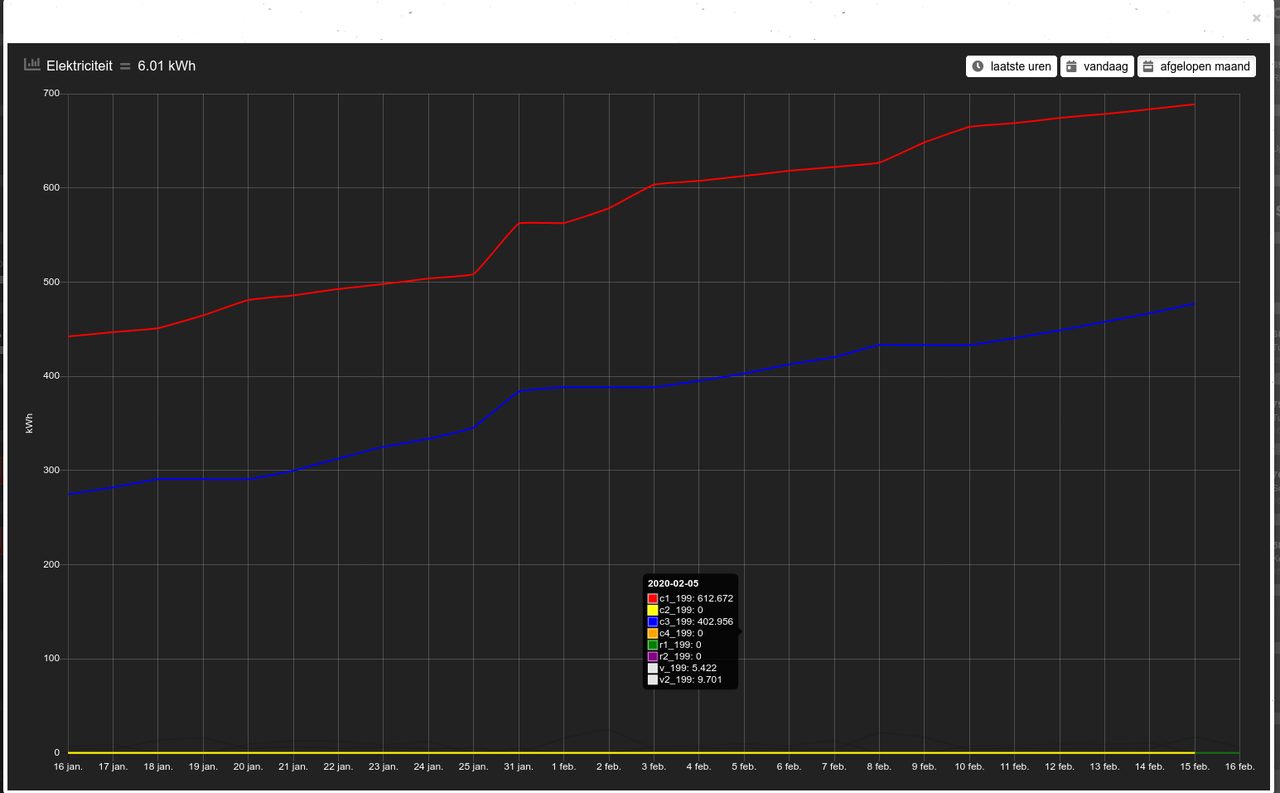
- the popup graphs seem to ignore the graphTypes parameter on some occasions. Can't explain
I see a feature request coming up soonclinkadink wrote: Saturday 15 February 2020 13:41 *snip**snip*
- Popups do not use block config parameters such as interval, because there is no block config for popups. They are dynamically generated.
- Same reason as my second point, popups don't know graphTypes - because there is no block config for popups.
By keys you mean c1 is kWh and v_200 is m³? I can provide a complete list of that.clinkadink wrote: Saturday 15 February 2020 13:41
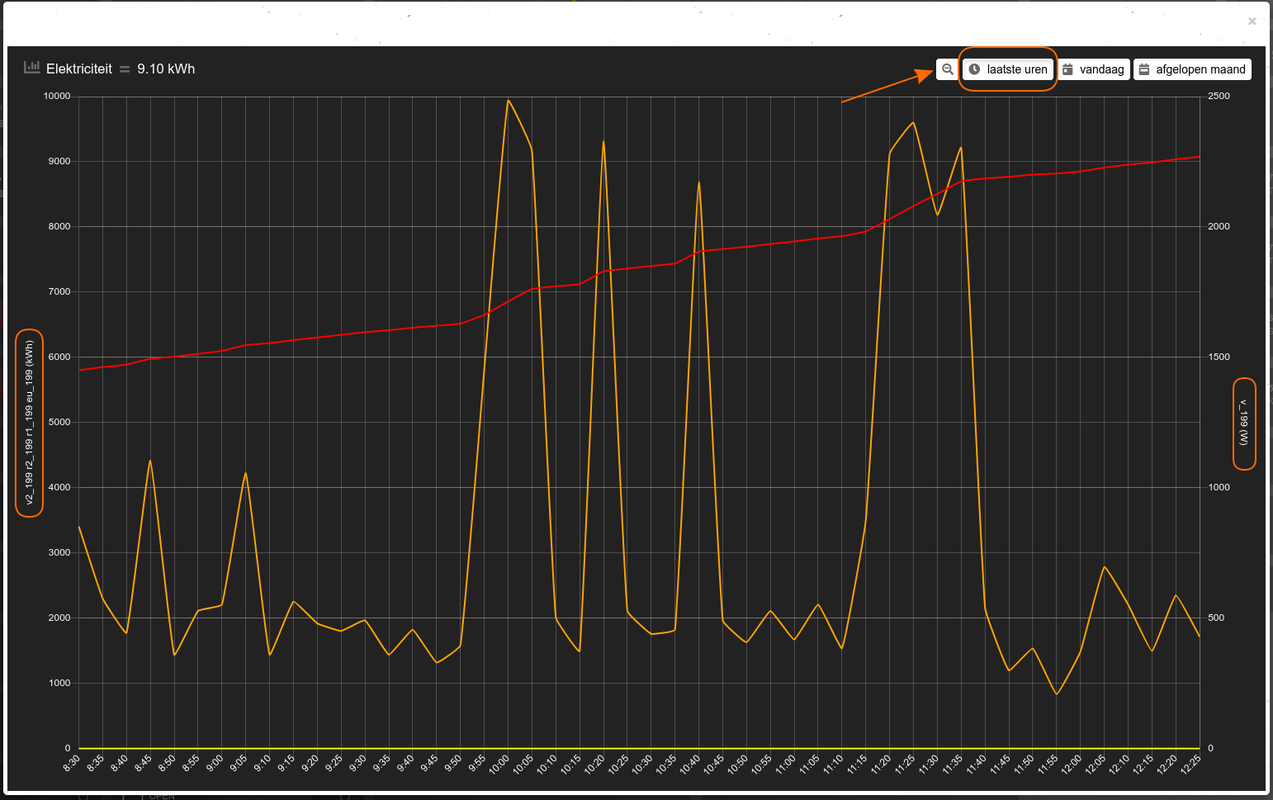
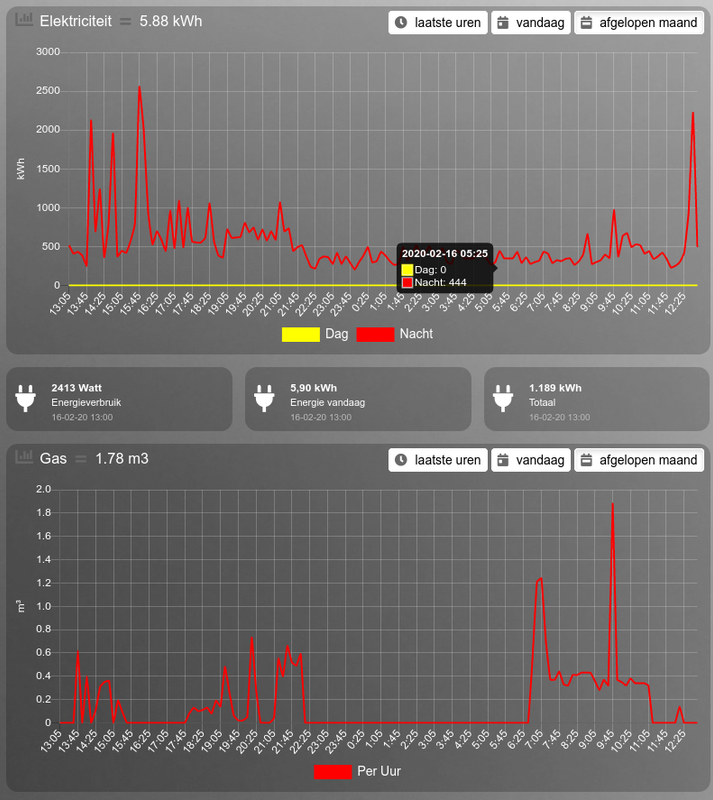
- I am guessing that your popups are not showing the correct unit of measure consistently, because the device changes the unit factor per range. For example, for electric with the range set to "hours", it looks like the unit of measure is watts. But when you switch to "day" or more, the unit changes to kWh. The code is not currently allowing for this. I will investigate what can be done. What would be helpful is if you can provide me a list of keys, for each range, for each device (electric and gas) including their unit of measure, e.g. W, kWh, m3, etc. As I don't have these devices, so it makes it very challenging for me to test this.
Yes please. And don't forget, your keys change when pressing the buttons. The last button returns frequently more keys and sometimes changed key names. That is Domoticz behaviour, not Dashticz. For example, to be 100% sure, I need ...Sjonnie2017 wrote: Saturday 15 February 2020 15:11 By keys you mean c1 is kWh and v_200 is m³? I can provide a complete list of that (it will be an edit to this post).


Code: Select all
toolTipStyle: true,I am relying on folks like you to test, so many thanks!Sjonnie2017 wrote: Sunday 16 February 2020 13:58 It is nice to be able to assist
Users browsing this forum: No registered users and 1 guest