Multiple sources in one graph

Dashticz, alternative dashboard based on HTML, CSS, jQuery

Moderators: leecollings, htilburgs, robgeerts

User avatar
Sjonnie2017
Posts: 361
Joined: Wednesday 02 August 2017 19:43
Target OS: Linux
Domoticz version: Latest ß
Location: The Netherlands
Contact:

Re: Multiple sources in one graph

Post by Sjonnie2017 »

I think I have too much time on my hands today ;)

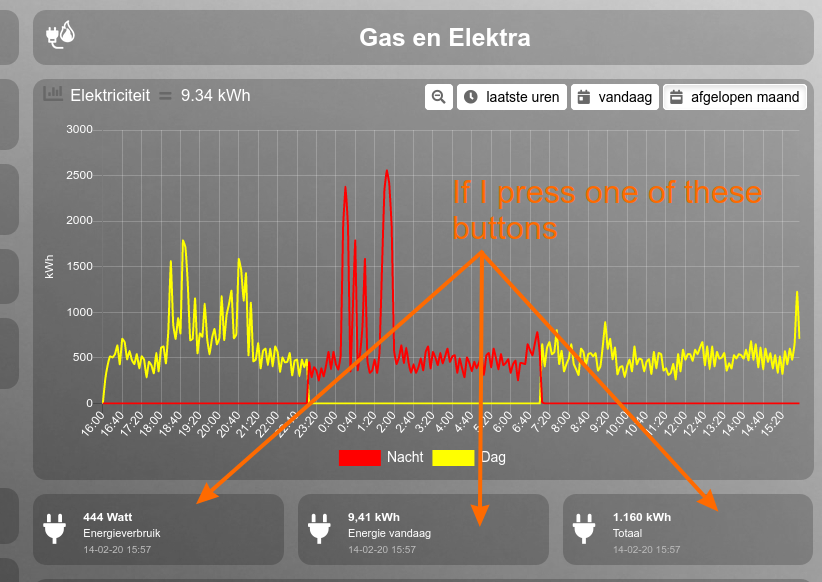
I have a number of buttons (blocks) beneath my electricity graph. If I press on of the buttons I get another graph than the one I defined in my config.js. Would be nice if they were the same graphs :mrgreen:
Image

Image

Greetz,

Sjonnie
ConBee II - TRÅDFRI lights + switches, loads of ChingLing dimmers and switches, Heiman and Xiaomi sensors
SolarEdge SE4000H (with active modbus_tcp)
YouLess Energy meter
Shelly 2.5 in roller shutter mode
User avatar
clinkadink
Posts: 417
Joined: Tuesday 31 December 2019 1:15
Target OS: Linux
Domoticz version: 2020.2
Location: Swindon, UK
Contact:

Re: Multiple sources in one graph

Post by clinkadink »

Sjonnie2017 wrote: Friday 14 February 2020 15:49 The order of the legend is not a big issue. It's a "nice to have". I think focusing on the height issue is indeed more important.
Yes, understood. Please can you log this as a "Feature Request" with title "Graph - Sort Legend"? Otherwise this may "get lost the post".
https://www.domoticz.com/forum/viewforum.php?f=78
Sjonnie2017 wrote: Friday 14 February 2020 15:49 I am not sure if you are now the "lead developer" of the graphs in Dashticz. But if so I would like to propose something for the "roadmap" if I may?
Ha, no. Like you, I am a Dashticz user, who likes graphs ;)
Sjonnie2017 wrote: Friday 14 February 2020 15:49 The graph for Electricity is showing the total usage of the current day in the header where the graph for Gas shows me the total usage of all time in the header. Would be a "nice to have" (also) if this was configurable. See my numerous screenshots for examples :lol:
I know what you mean. It sounds like it can be achieved. Please can you log this as a "Feature Request" with title "Graph - Custom Header"?
https://www.domoticz.com/forum/viewforum.php?f=78
"UI is the saddle, the stirrups, & the reins. UX is the feeling you get being able to ride the horse."
User avatar
clinkadink
Posts: 417
Joined: Tuesday 31 December 2019 1:15
Target OS: Linux
Domoticz version: 2020.2
Location: Swindon, UK
Contact:

Re: Multiple sources in one graph

Post by clinkadink »

Sjonnie2017 wrote: Friday 14 February 2020 16:07 I have a number of buttons (blocks) beneath my electricity graph. If I press on of the buttons I get another graph than the one I defined in my config.js. Would be nice if they were the same graphs :mrgreen:
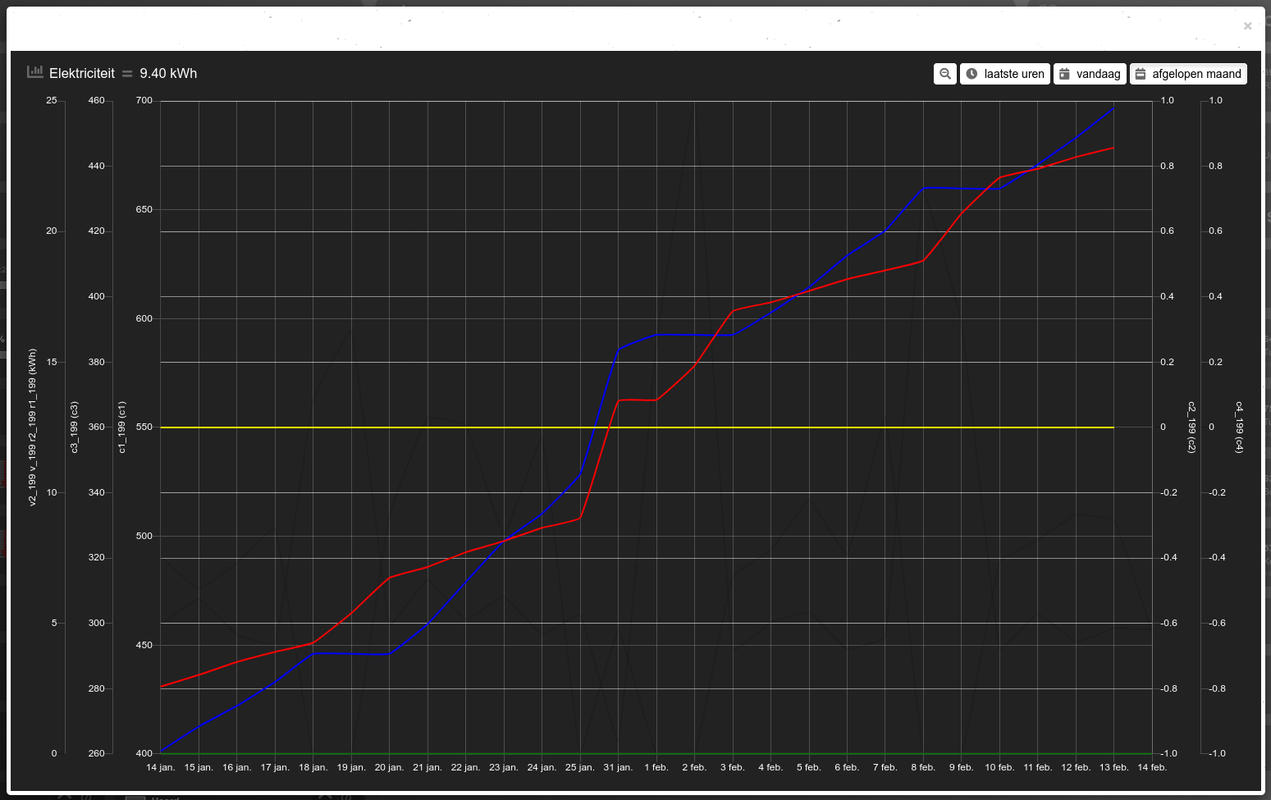
This is only because in your main graph, you have a block defined with graphTypes limiting the data that is displayed. Popups are dynamically generated, and would not be able to limit the data. I.e. it will show all keys, which obviously changes the appearance, scale, amount of Y axes, of your popup.
"UI is the saddle, the stirrups, & the reins. UX is the feeling you get being able to ride the horse."
User avatar
Sjonnie2017
Posts: 361
Joined: Wednesday 02 August 2017 19:43
Target OS: Linux
Domoticz version: Latest ß
Location: The Netherlands
Contact:

Re: Multiple sources in one graph

Post by Sjonnie2017 »

Will add the feature request tomorrow. Thanks for the tip (and your support of course... but that's obvious :) )
ConBee II - TRÅDFRI lights + switches, loads of ChingLing dimmers and switches, Heiman and Xiaomi sensors
SolarEdge SE4000H (with active modbus_tcp)
YouLess Energy meter
Shelly 2.5 in roller shutter mode
dgrostoto
Posts: 7
Joined: Monday 10 February 2020 0:57
Target OS: Raspberry Pi / ODroid
Domoticz version:
Contact:

Re: Multiple sources in one graph

Post by dgrostoto »

Hello,
I've just git clone the repo and retested but the maxTicksLimit seems still broken.
Do you wan't a sample of code for testing ?
User avatar
clinkadink
Posts: 417
Joined: Tuesday 31 December 2019 1:15
Target OS: Linux
Domoticz version: 2020.2
Location: Swindon, UK
Contact:

Re: Multiple sources in one graph

Post by clinkadink »

I am using maxTicksLimit now. Also in the example posted with the latest beta (post below). I limit to 20 ticks.

https://www.domoticz.com/forum/viewtopi ... 20#p236733

Please can you share your code.
"UI is the saddle, the stirrups, & the reins. UX is the feeling you get being able to ride the horse."
User avatar
clinkadink
Posts: 417
Joined: Tuesday 31 December 2019 1:15
Target OS: Linux
Domoticz version: 2020.2
Location: Swindon, UK
Contact:

Re: Multiple sources in one graph

Post by clinkadink »

Made some progress this evening.

(1) have found the issue with the height parameter. Those who reported it, thank you. There was a significant code change in the last beta, 3.3.4, and consequently, I missed a few bits :shock: Users will be able to set the height of their graph manually. Example:

Code: Select all

height: '300px',
(2) The drawOrderLast, drawOrderDay and drawOrderMonth also stopped working. The same reason as above. Yet these are now also fixed. A few people have queried what these properties do. These properties now do 2 things - for each button, i.e last, day, month (or whatever range you use):
  • Changes the order in which the datasets are drawn on to the graph (rendered on the canvas). This is only useful if you use lineFill, to prevent smaller datasets behind larger datasets.
  • It changes the order of the Legend for each button (last, day, month)
(3) Until now, the legend is added in alphanumeric order using the "key" name. So if you imagine a legend with ...

Code: Select all

legend: {
   'te_72': 'Inside',	
   'te_6': 'Outside'   
}
Even though the order of the legend object is Inside then Outside, the legend on the graph would always be added Outside, then Inside. This is because te_6 comes before te_72. But now it adds legend in the same order as specified in your block config.

(4) Minor updates:
  • Gas devices (SubType = Gas) now display 'current day usage' instead of 'all time usage' in the header of the graph.
  • Keys for c1, c2, c3, c4 with SubType = Energy, will display the unit 'kWh'
  • Keys for c1, c2, c3, c4 with SubType = Gas, will display the unit 'm3'
  • Tooltip graph values have been fixed to 2 decimal places
This update is available using the latest beta (updated at 10pm UTC this evening).

Cheers ;)
"UI is the saddle, the stirrups, & the reins. UX is the feeling you get being able to ride the horse."
User avatar
clinkadink
Posts: 417
Joined: Tuesday 31 December 2019 1:15
Target OS: Linux
Domoticz version: 2020.2
Location: Swindon, UK
Contact:

Re: Multiple sources in one graph

Post by clinkadink »

Sjonnie2017 wrote: Friday 14 February 2020 17:55 Will add the feature request tomorrow. Thanks for the tip (and your support of course... but that's obvious :) )
No need ;)
"UI is the saddle, the stirrups, & the reins. UX is the feeling you get being able to ride the horse."
User avatar
Sjonnie2017
Posts: 361
Joined: Wednesday 02 August 2017 19:43
Target OS: Linux
Domoticz version: Latest ß
Location: The Netherlands
Contact:

Re: Multiple sources in one graph

Post by Sjonnie2017 »

clinkadink wrote: Friday 14 February 2020 23:30
Sjonnie2017 wrote: Friday 14 February 2020 17:55 Will add the feature request tomorrow. Thanks for the tip (and your support of course... but that's obvious :) )
No need ;)
And I thought I had too much time on my hands yesterday :lol:

Do you ever sleep I wonder ;)

Anyway... thank you very much for the updated code. I'll start testing in a moment.

Greetz,

Sjonnie
ConBee II - TRÅDFRI lights + switches, loads of ChingLing dimmers and switches, Heiman and Xiaomi sensors
SolarEdge SE4000H (with active modbus_tcp)
YouLess Energy meter
Shelly 2.5 in roller shutter mode
User avatar
Sjonnie2017
Posts: 361
Joined: Wednesday 02 August 2017 19:43
Target OS: Linux
Domoticz version: Latest ß
Location: The Netherlands
Contact:

Re: Multiple sources in one graph

Post by Sjonnie2017 »

OK, I tested the graphs thoroughly I believe. I haven't changed my code apart for the legend for electricity which now indeed shows "Dag" before "Nacht". To paraphrase Neil Armstrong: A small step for Clinkadink but a huge leap for me :lol:

A few things I noticed:
  • the multigraphs work like a charm! :mrgreen:
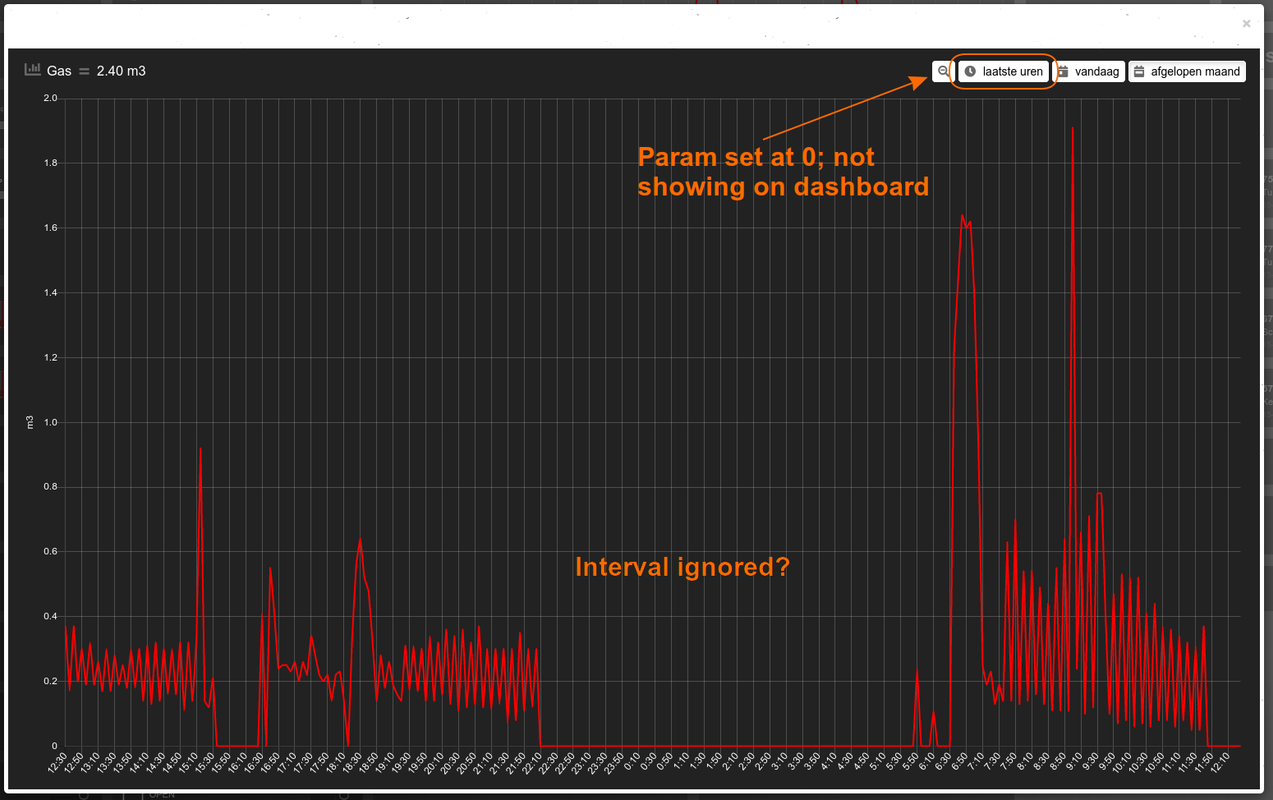
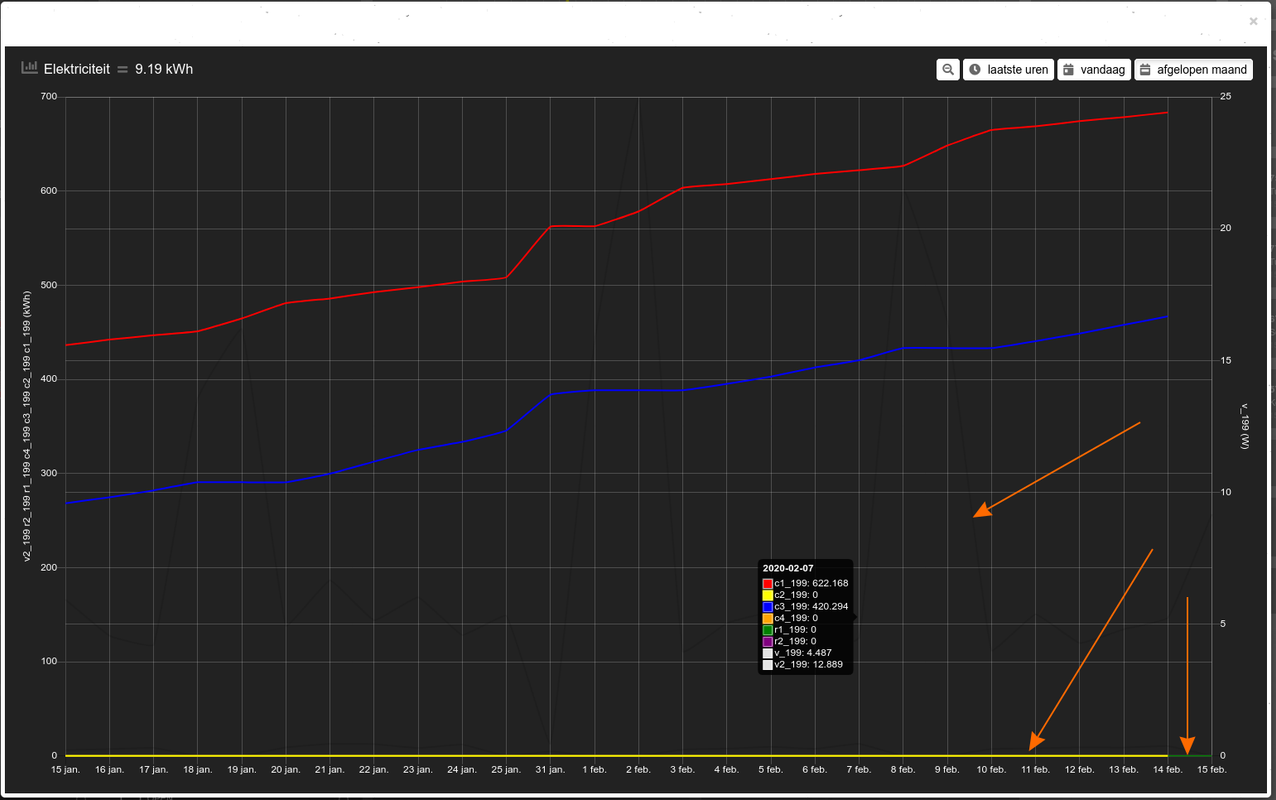
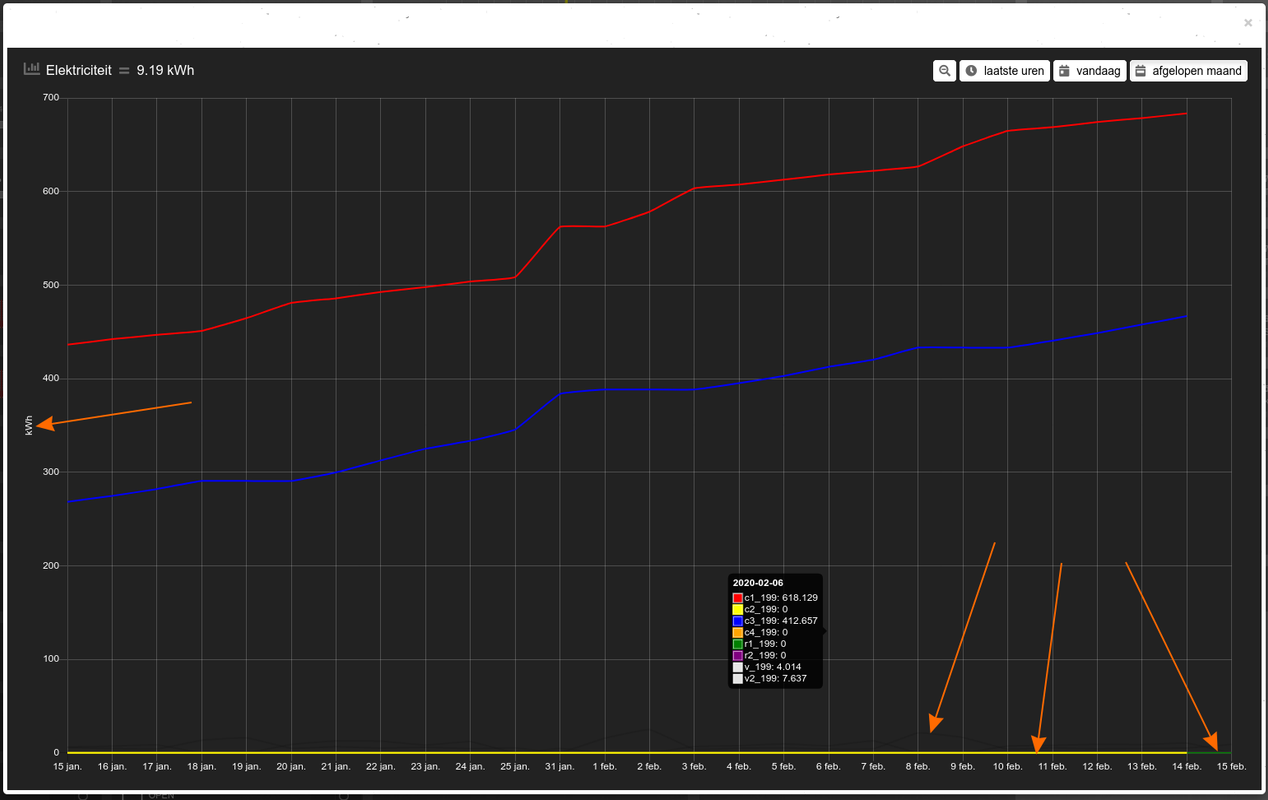
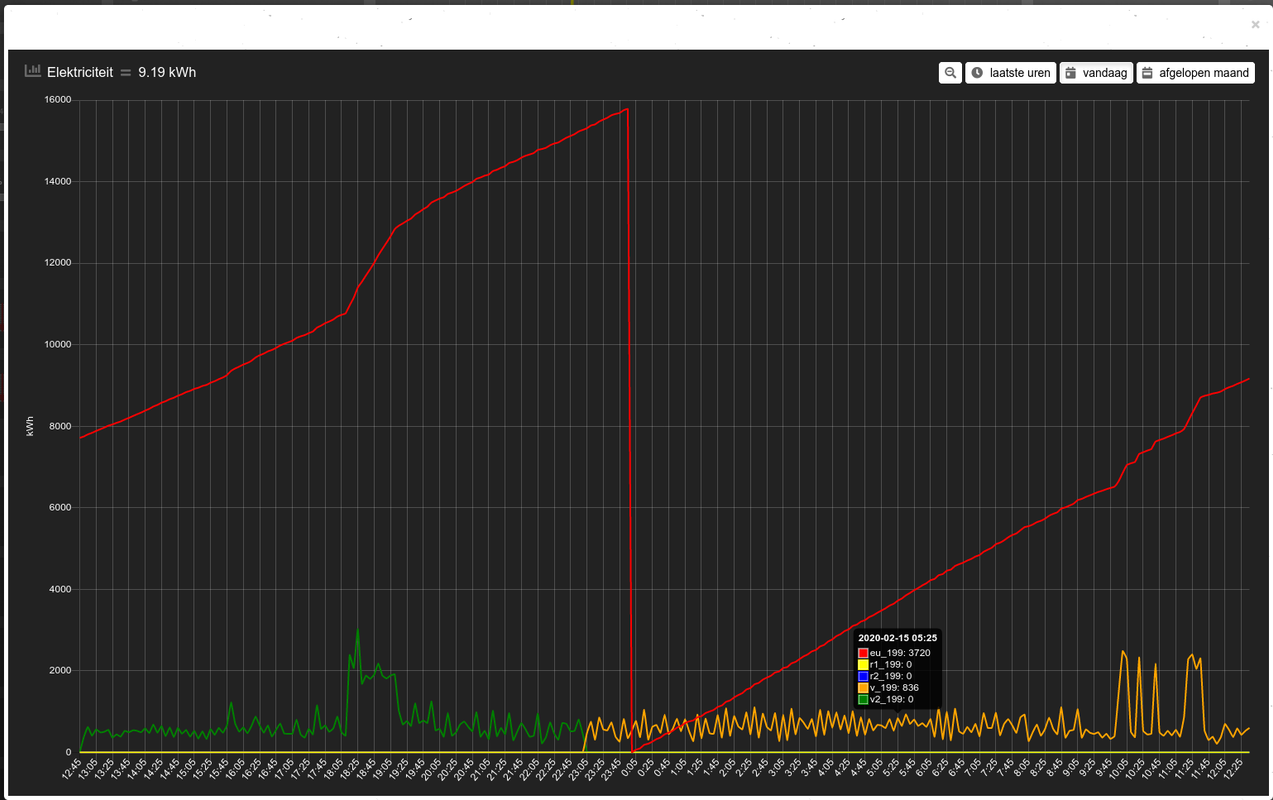
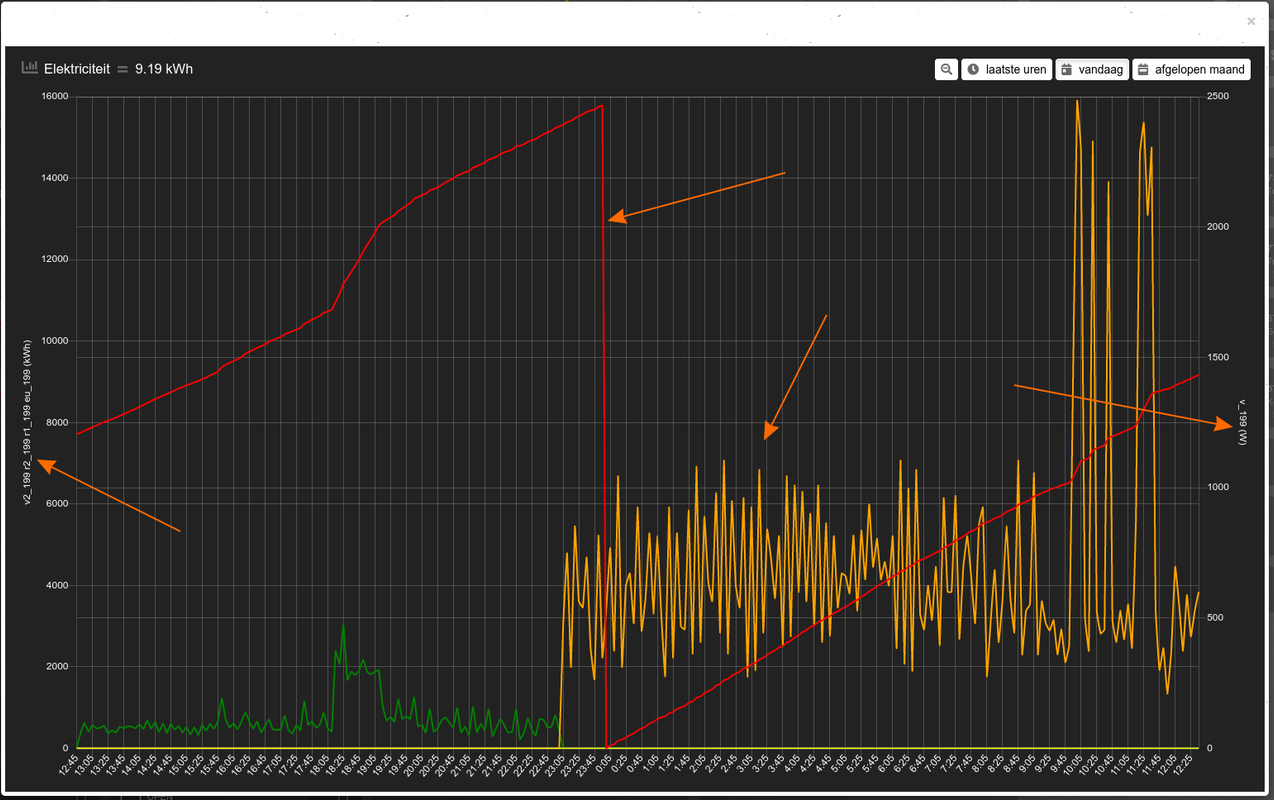
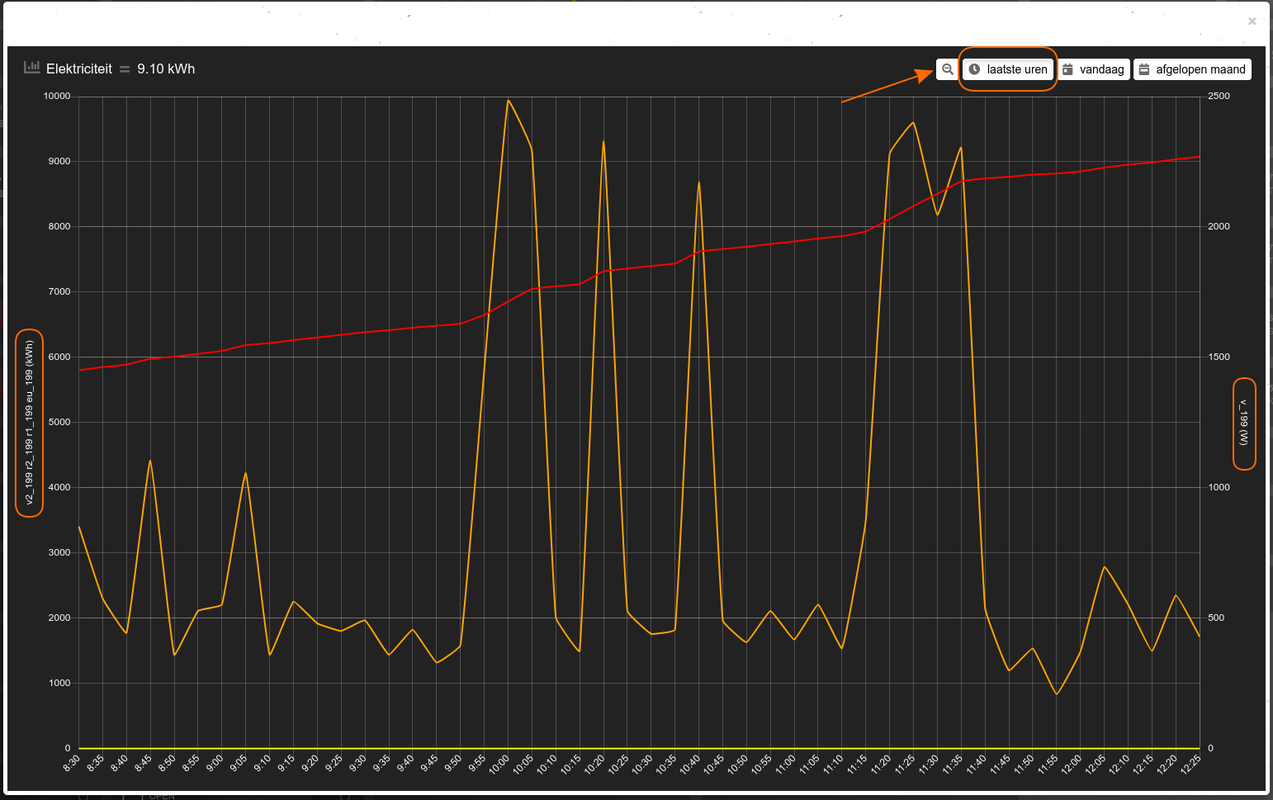
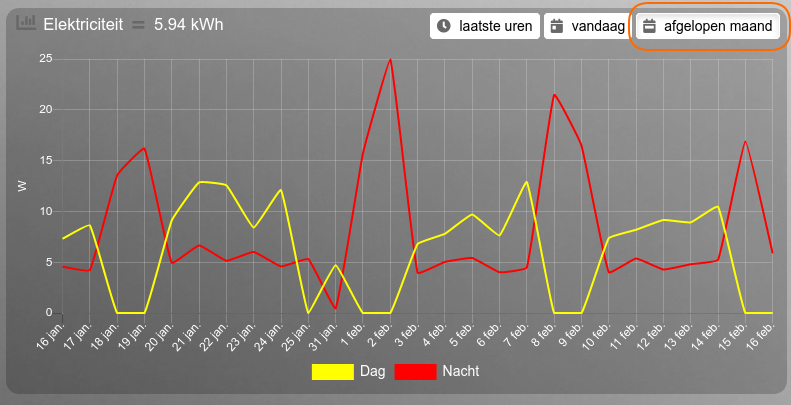
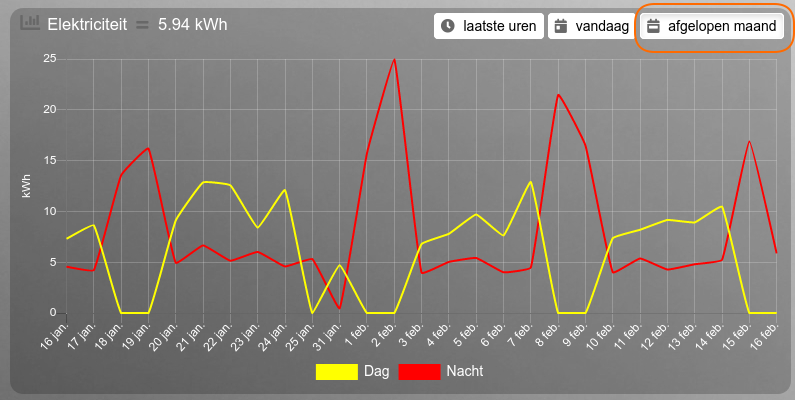
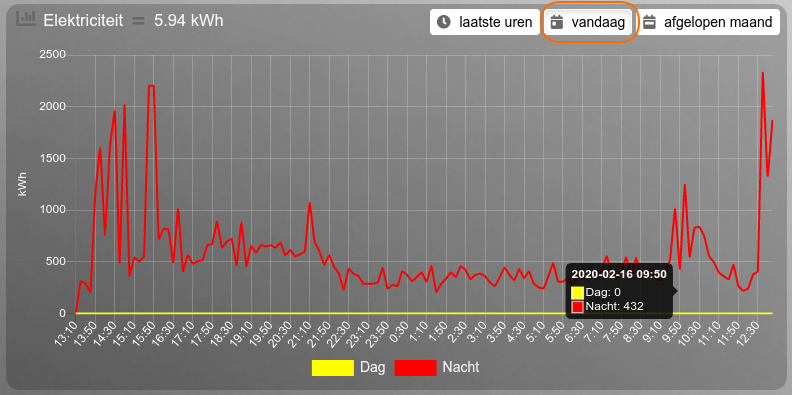
  • the popup graphs seem to ignore some parameters (like interval) and seem to render differently if I select a period (like today) more than once in the same session/popup. If I close the popup and open it again I get the same behavior. I hope I can clarify with some screenshots.
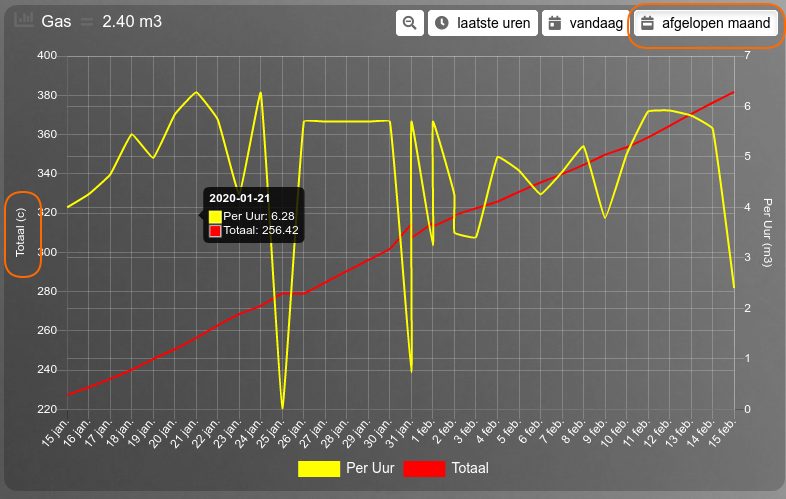
  • the graphs do not always show the right unit of measurement; see pictures
  • the popup graphs seem to ignore the graphTypes parameter on some occasions. Can't explain
And now for the pictures:

EDIT: On some pictures I indicated the zoom button. I thought I had set the parameter to 0 but I didn't so please ignore these remarks on the pictures. (But it is too time consuming to recreate the pictures ;) )

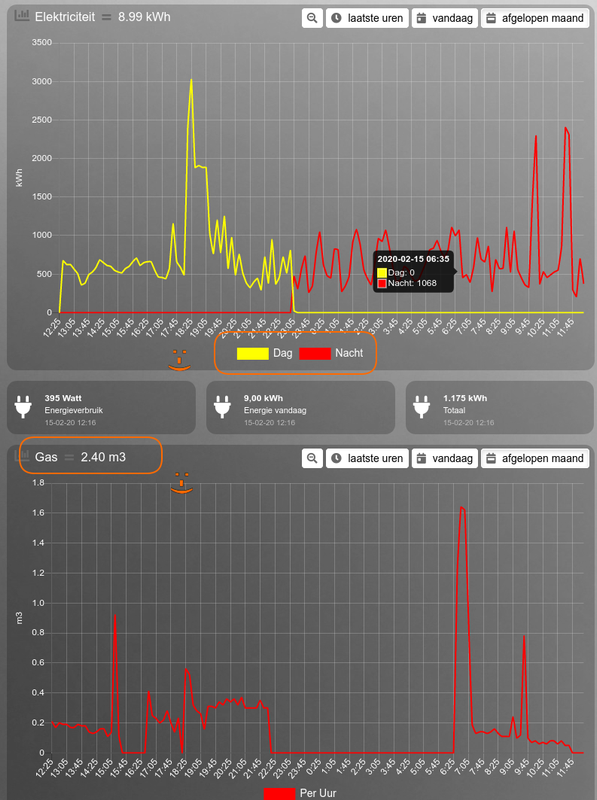
Dashboard Electricity and Gas (with interval):
Image

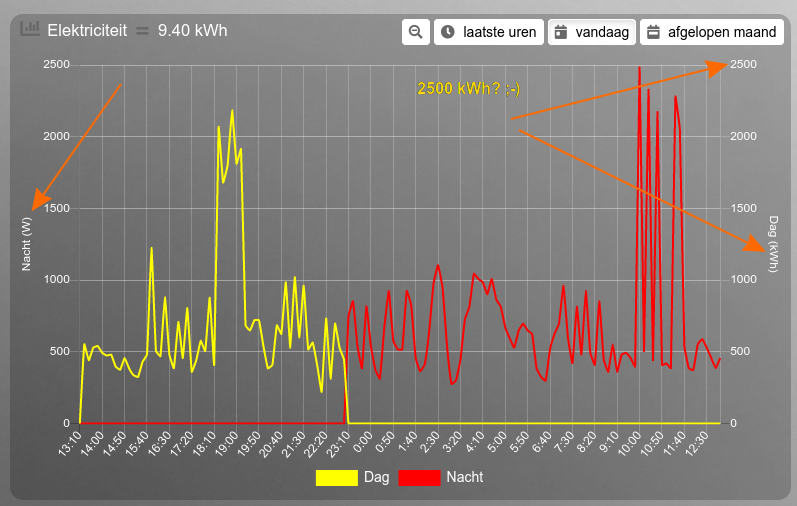
I noticed that when I play with the popup graphs for Electricity for a while and then return to the dashboard and click on today or wait for the graph to refresh I get this:
Image

Popup Gas ignoring interval:
Image

Dashboard Gas showing incorrect unit:
Image

Popup Electricity Month on first click (note that I filtered 'eu' in the block definition):
Image

Popup Electricity Month on second click:
Image

Popup Electricity on first click:
Image

Popup Electricity on second click:
Image

Popup Electricity showing wrong legend on first click:
Image

Hope this helps!

Greetz,

Sjonnie
ConBee II - TRÅDFRI lights + switches, loads of ChingLing dimmers and switches, Heiman and Xiaomi sensors
SolarEdge SE4000H (with active modbus_tcp)
YouLess Energy meter
Shelly 2.5 in roller shutter mode
User avatar
clinkadink
Posts: 417
Joined: Tuesday 31 December 2019 1:15
Target OS: Linux
Domoticz version: 2020.2
Location: Swindon, UK
Contact:

Re: Multiple sources in one graph

Post by clinkadink »

Sjonnie2017 wrote: Saturday 15 February 2020 13:15
  • the multigraphs work like a charm! :mrgreen:
  • the popup graphs seem to ignore some parameters (like interval) and seem to render differently if I select a period (like today) more than once in the same session/popup. If I close the popup and open it again I get the same behavior. I hope I can clarify with some screenshots.
  • the graphs do not always show the right unit of measurement; see pictures
  • the popup graphs seem to ignore the graphTypes parameter on some occasions. Can't explain
Thanks for testing this and the detailed feedback ;)
  • Glad to hear the multigraphs are working well.
  • Popups do not use block config parameters such as interval, because there is no block config for popups. They are dynamically generated.
  • I am guessing that your popups are not showing the correct unit of measure consistently, because the device changes the unit factor per range. For example, for electric with the range set to "hours", it looks like the unit of measure is watts. But when you switch to "day" or more, the unit changes to kWh. The code is not currently allowing for this. I will investigate what can be done. What would be helpful is if you can provide me a list of keys, for each range, for each device (electric and gas) including their unit of measure, e.g. W, kWh, m3, etc. As I don't have these devices, so it makes it very challenging for me to test this.
  • Same reason as my second point, popups don't know graphTypes - because there is no block config for popups.
"UI is the saddle, the stirrups, & the reins. UX is the feeling you get being able to ride the horse."
User avatar
Sjonnie2017
Posts: 361
Joined: Wednesday 02 August 2017 19:43
Target OS: Linux
Domoticz version: Latest ß
Location: The Netherlands
Contact:

Re: Multiple sources in one graph

Post by Sjonnie2017 »

clinkadink wrote: Saturday 15 February 2020 13:41 *snip*
  • Popups do not use block config parameters such as interval, because there is no block config for popups. They are dynamically generated.
*snip*
  • Same reason as my second point, popups don't know graphTypes - because there is no block config for popups.
I see a feature request coming up soon :lol:
clinkadink wrote: Saturday 15 February 2020 13:41
  • I am guessing that your popups are not showing the correct unit of measure consistently, because the device changes the unit factor per range. For example, for electric with the range set to "hours", it looks like the unit of measure is watts. But when you switch to "day" or more, the unit changes to kWh. The code is not currently allowing for this. I will investigate what can be done. What would be helpful is if you can provide me a list of keys, for each range, for each device (electric and gas) including their unit of measure, e.g. W, kWh, m3, etc. As I don't have these devices, so it makes it very challenging for me to test this.
By keys you mean c1 is kWh and v_200 is m³? I can provide a complete list of that.

Greetz,

Sjonnie
Last edited by Sjonnie2017 on Saturday 15 February 2020 15:28, edited 1 time in total.
ConBee II - TRÅDFRI lights + switches, loads of ChingLing dimmers and switches, Heiman and Xiaomi sensors
SolarEdge SE4000H (with active modbus_tcp)
YouLess Energy meter
Shelly 2.5 in roller shutter mode
User avatar
clinkadink
Posts: 417
Joined: Tuesday 31 December 2019 1:15
Target OS: Linux
Domoticz version: 2020.2
Location: Swindon, UK
Contact:

Re: Multiple sources in one graph

Post by clinkadink »

Sjonnie2017 wrote: Saturday 15 February 2020 15:11 By keys you mean c1 is kWh and v_200 is m³? I can provide a complete list of that (it will be an edit to this post).
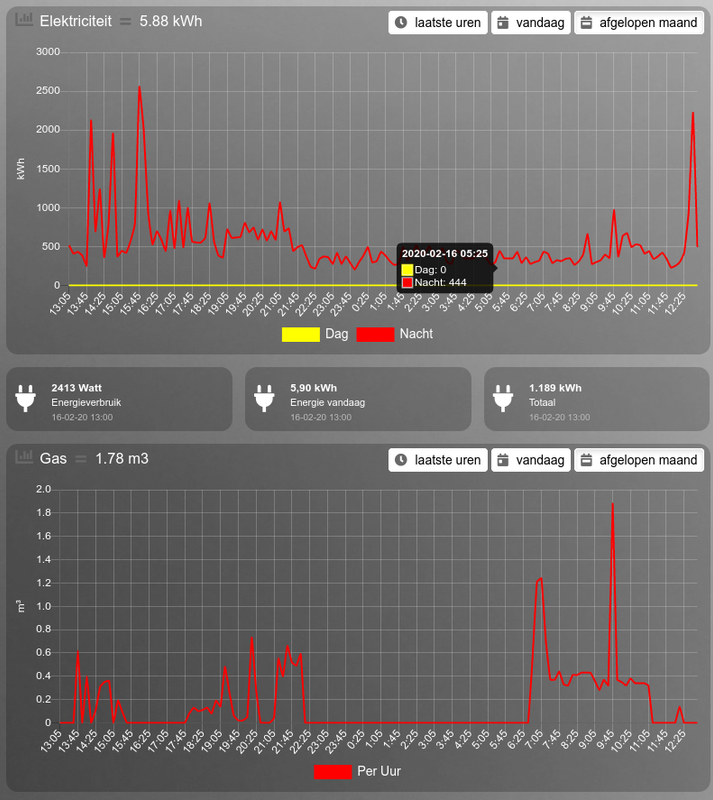
Yes please. And don't forget, your keys change when pressing the buttons. The last button returns frequently more keys and sometimes changed key names. That is Domoticz behaviour, not Dashticz. For example, to be 100% sure, I need ...

Last: Electric keys + unit, Gas Keys + unit
Today: Electric keys + unit, Gas Keys + unit
Month: Electric keys + unit, Gas Keys + unit
"UI is the saddle, the stirrups, & the reins. UX is the feeling you get being able to ride the horse."
User avatar
Sjonnie2017
Posts: 361
Joined: Wednesday 02 August 2017 19:43
Target OS: Linux
Domoticz version: Latest ß
Location: The Netherlands
Contact:

Re: Multiple sources in one graph

Post by Sjonnie2017 »

OK, I think I have got all the keys and they unit of measure. Since I do not have solar panels or a wind turbine (but that one is coming :P ) I am not 100% sure about the "r"-keys and "c2" and "c4". But "logic dictates" that they are the same as the "v"-keys and the other "c"-keys.

Electricity
Last hours and today:
  • eu_199 - W
  • r1_199 - W
  • r2_199 - W
  • v_199 - W
  • v2_199 - W
Last Month:
  • c1_199 - kWh
  • c2_199 - kWh
  • c3_199 - kWh
  • c4_199 - kWh
  • r1_199 - kWh
  • r2_199 - kWh
  • v_199 - kWh
  • v2_199 - kWh
Gas
Last hours, Today and Last Month:
  • v_200 - m³
  • c_200 - m³
HTH

Greetz,

Sjonnie
ConBee II - TRÅDFRI lights + switches, loads of ChingLing dimmers and switches, Heiman and Xiaomi sensors
SolarEdge SE4000H (with active modbus_tcp)
YouLess Energy meter
Shelly 2.5 in roller shutter mode
User avatar
clinkadink
Posts: 417
Joined: Tuesday 31 December 2019 1:15
Target OS: Linux
Domoticz version: 2020.2
Location: Swindon, UK
Contact:

Re: Multiple sources in one graph

Post by clinkadink »

Check your PM.
"UI is the saddle, the stirrups, & the reins. UX is the feeling you get being able to ride the horse."
User avatar
Sjonnie2017
Posts: 361
Joined: Wednesday 02 August 2017 19:43
Target OS: Linux
Domoticz version: Latest ß
Location: The Netherlands
Contact:

Re: Multiple sources in one graph

Post by Sjonnie2017 »

Hi,

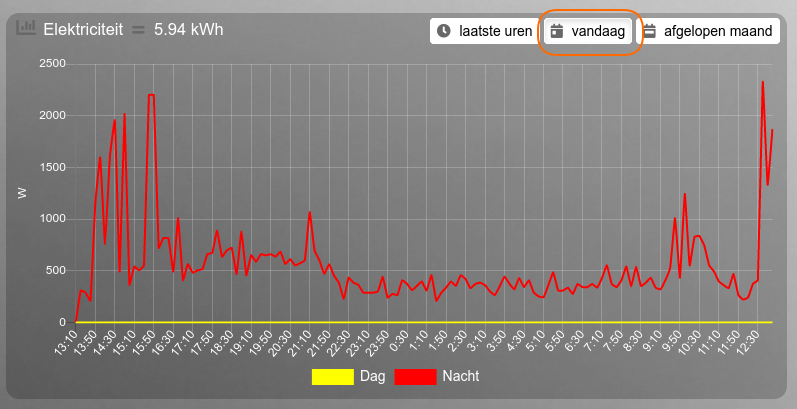
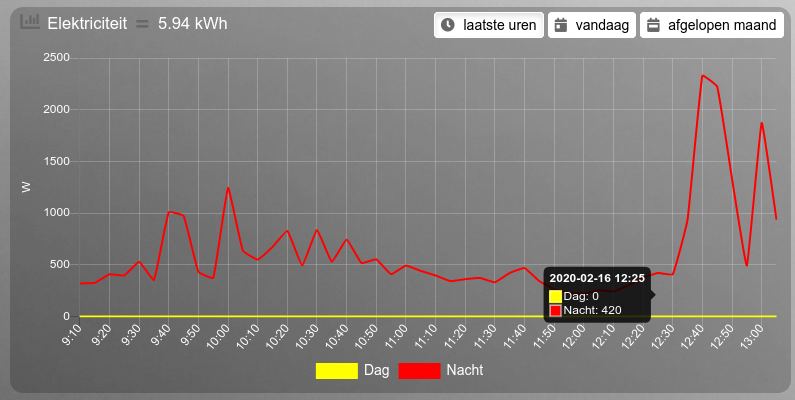
Thanks for the PM. I applied your solution as requested. I tested the dashboard graphs for electricity and the popup graphs for electricity. The gas graphs seem to work in both dashboard mode as well as popup mode. 8-)

Dashboard: if I click on Last month twice it shows me kWh (eg. 15kWh). If I then select last hours, on first click it shows me kWh (eg. 2000 kWh) and after the second click I get W (eg. 2000 W). Same applies for Today. If I select Last Hours it shows me W as unit of measurement. If I then select Last Month the first time it shows me W (eg. 20 W) and after the second click it shows me kWh (20 kWh). It looks like the unit of measurement is not immediately updated if I switch between different time measurements.

The pictures:

First load:
Image

First click on Last Month:
Image

Second click on Last Month:
Image

First click on Today after Last Month:
Image

Second click on Today after Last Month:
Image

First click on Last Hours after Today (and after Last Month):
Image

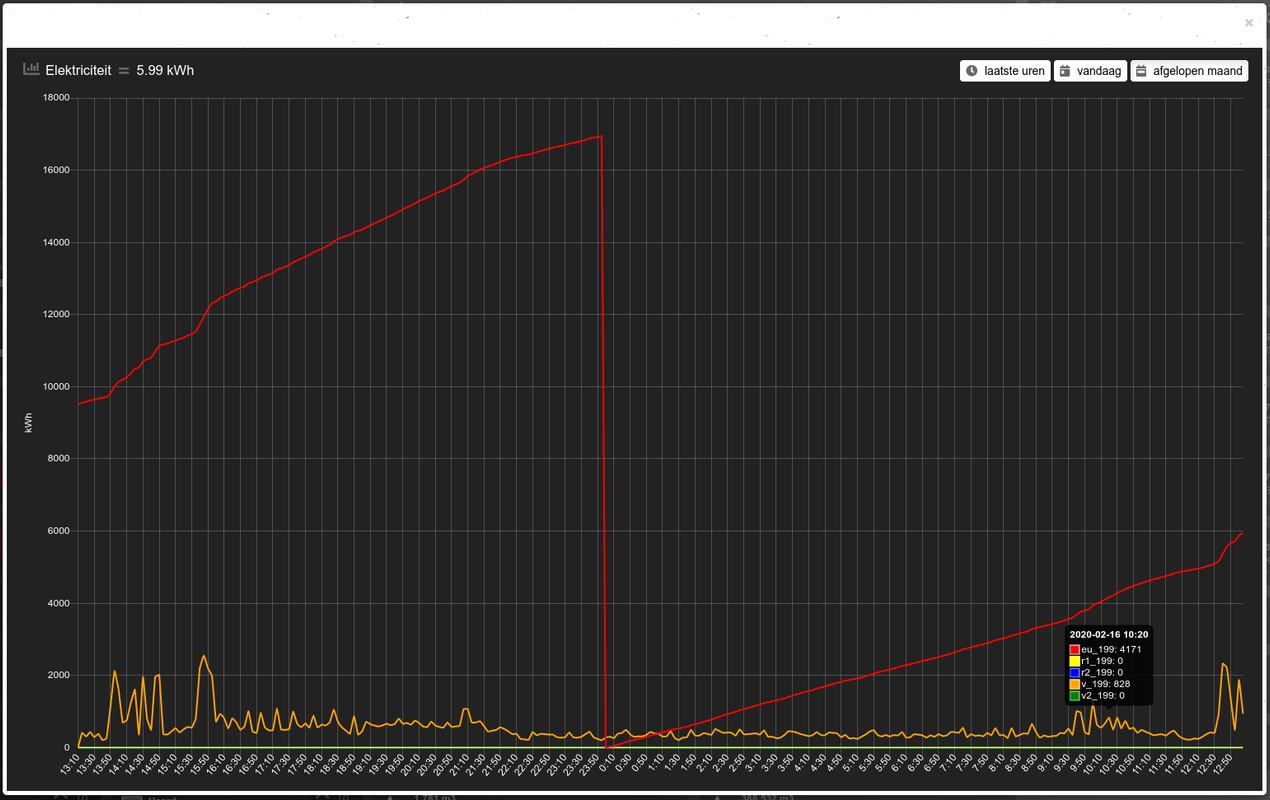
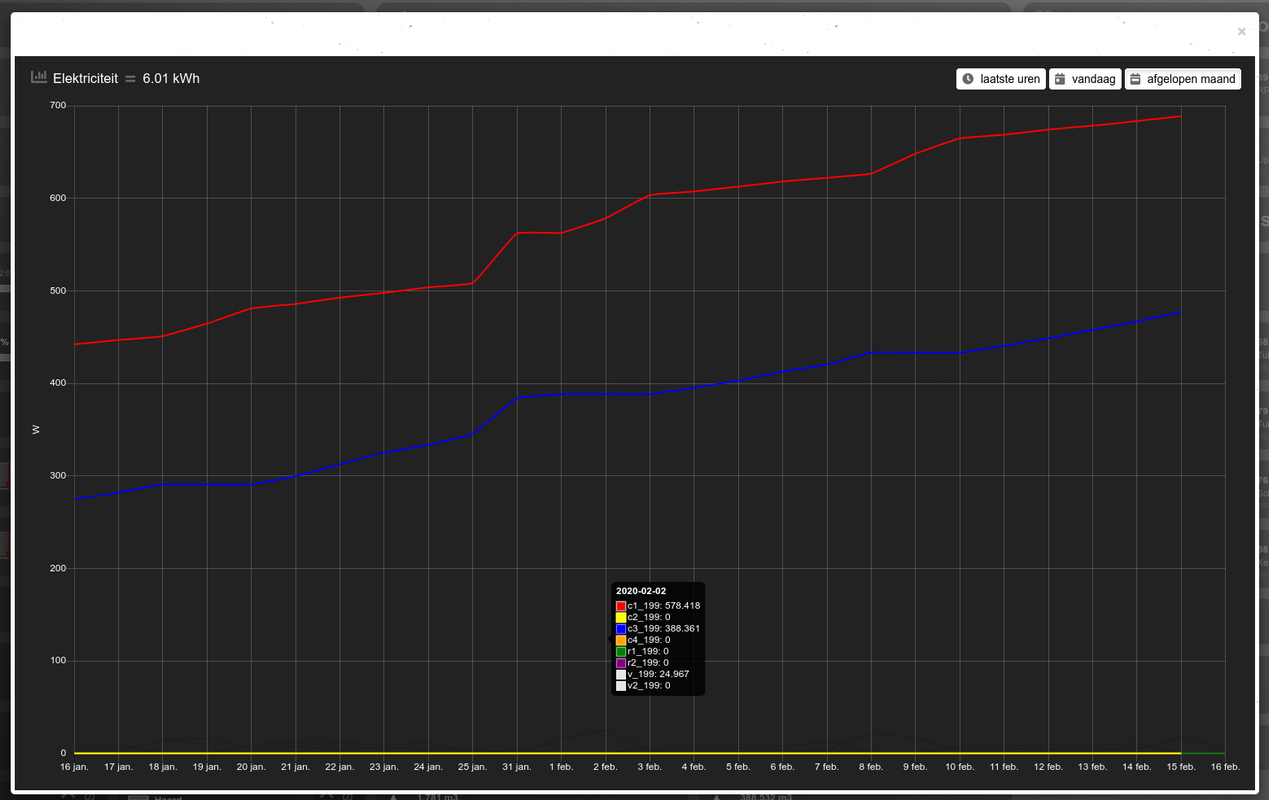
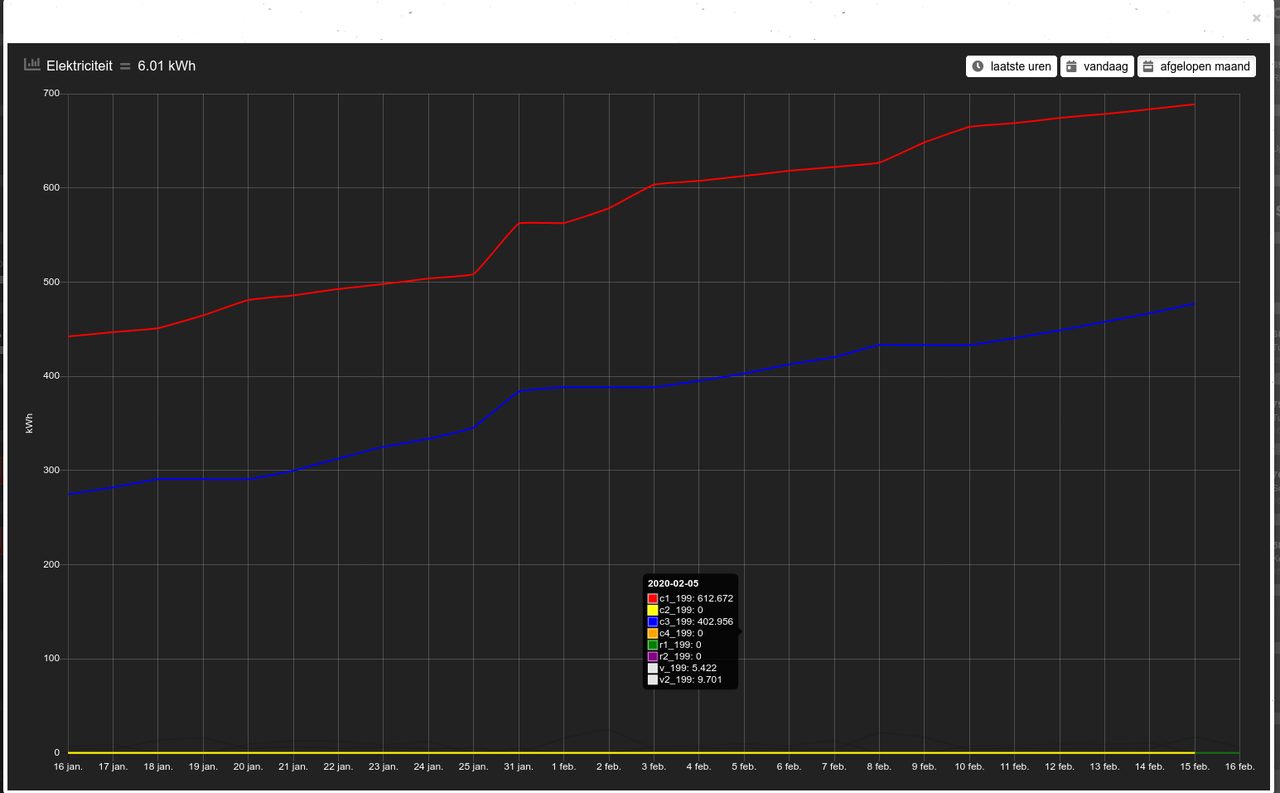
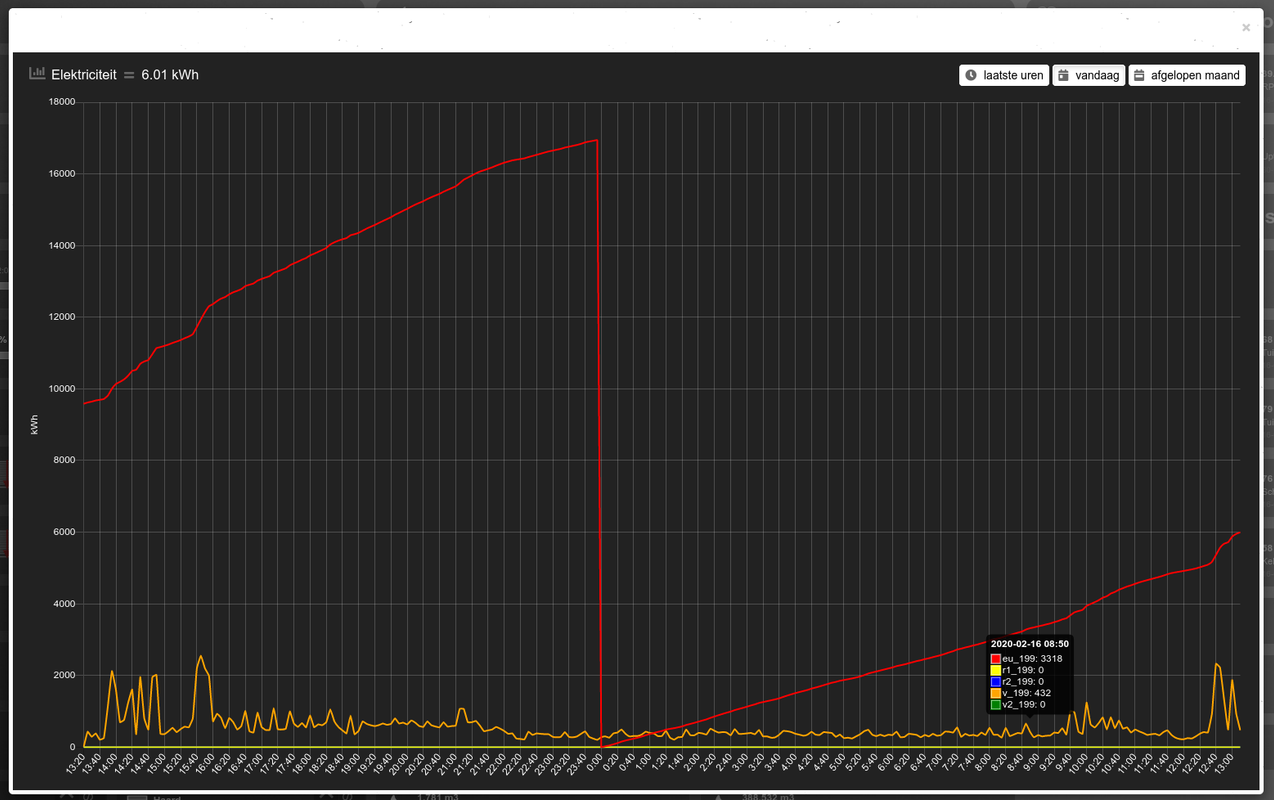
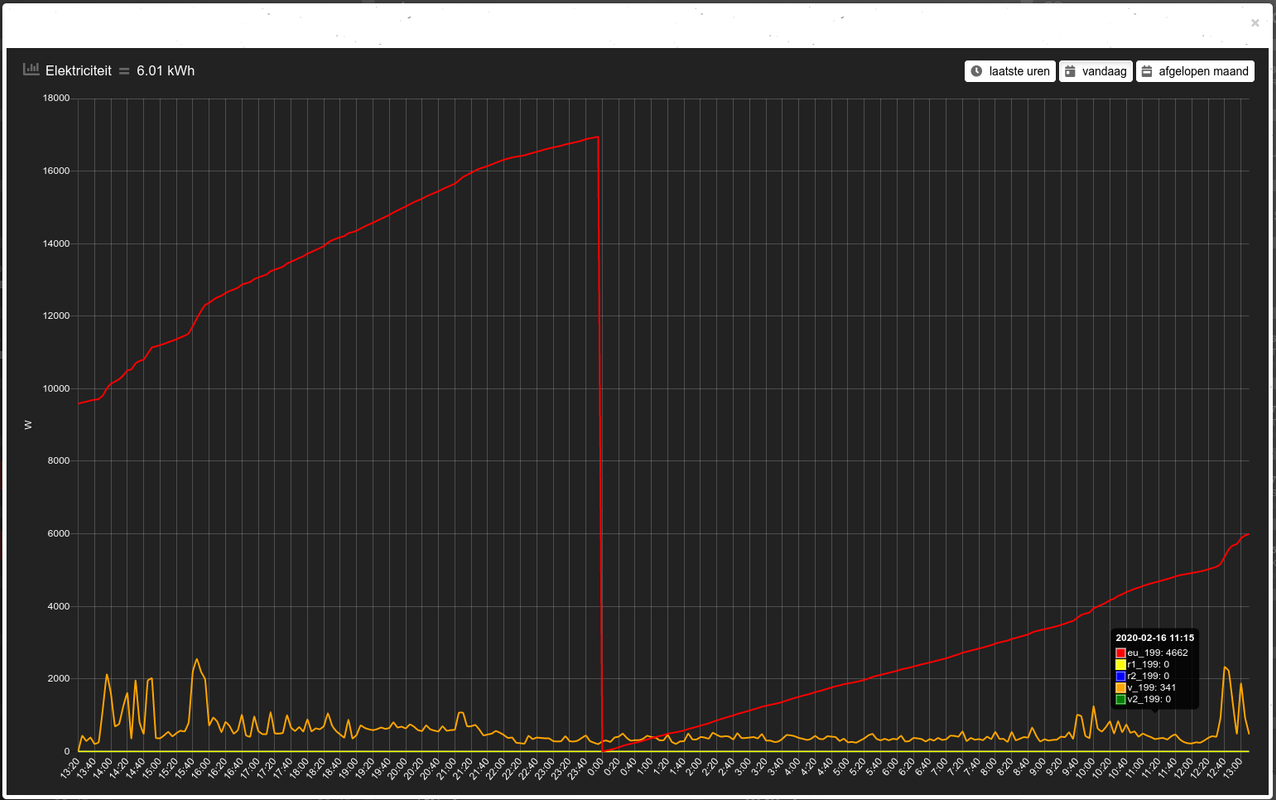
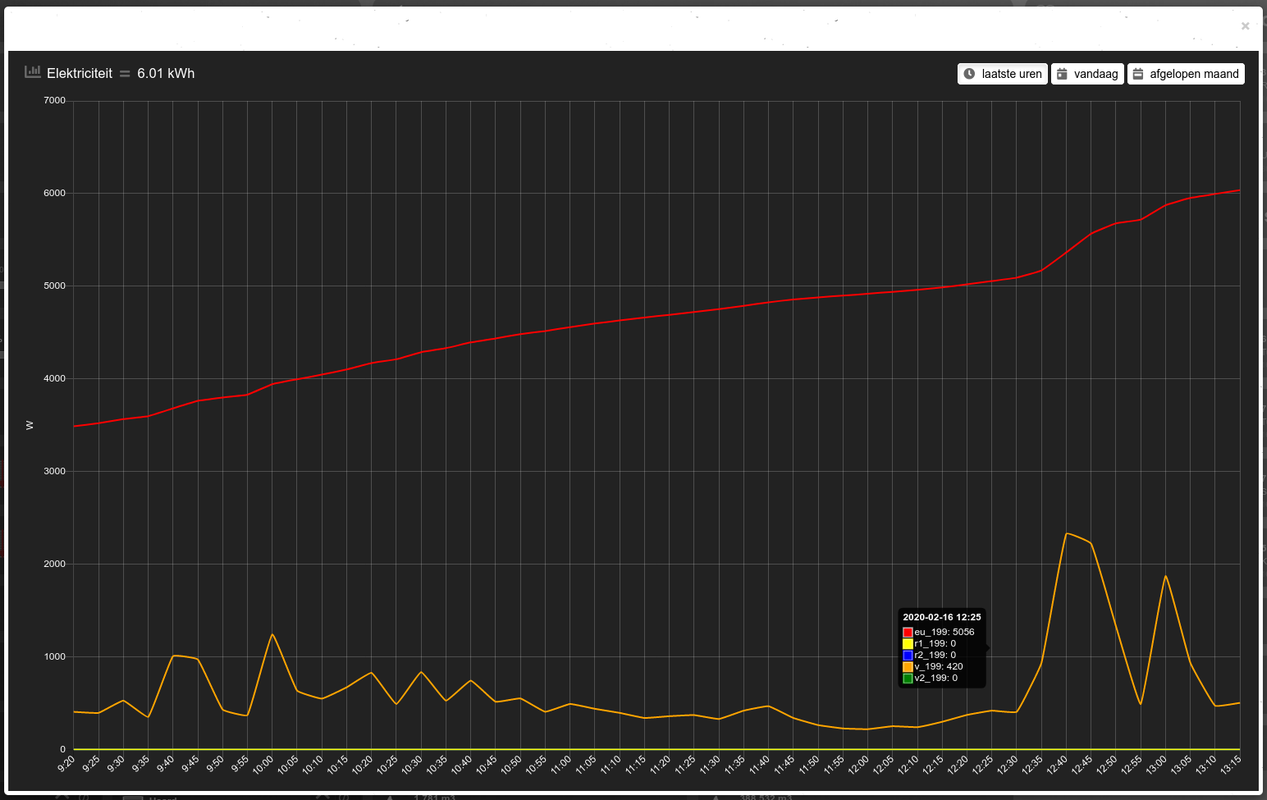
Popup: On first load it shows me Today and the unit of measrument is kWh. The Y-axis shows me values in thousands af Watts (eg. 16000 W). If I press Today after load nothing changes. If I press it the second time it changes UoM to W; the values remain the same. If I then press Last Month the UoM is W and the values range from 0 to 700. Press it again and the UoM changes to kWh; the values stay the same. If I subsequently press last hours the UoM stays(?)/is kWh; the values range from 0 to 7000. On second press the UoM changes to W; the values stay the same.

The pictures:

First load:
Image

First click on Last Month after initial load:
Image

Second click on Last Month:
Image

First click on Today after Last Month:
Image

Second click on Today:
Image

First click on Last Hours:
Image

Phew, there you have it :mrgreen:

PS. As and added bonus I now have the barometer graph showing true values in the header. First it was 1.02 HPa, now it shows 995.00 HPa (yes it is stormy weather today :P)

Greetz,

Sjonnie
ConBee II - TRÅDFRI lights + switches, loads of ChingLing dimmers and switches, Heiman and Xiaomi sensors
SolarEdge SE4000H (with active modbus_tcp)
YouLess Energy meter
Shelly 2.5 in roller shutter mode
User avatar
clinkadink
Posts: 417
Joined: Tuesday 31 December 2019 1:15
Target OS: Linux
Domoticz version: 2020.2
Location: Swindon, UK
Contact:

Re: Multiple sources in one graph

Post by clinkadink »

Thanks Sjonnie, great detail there ... it will help track down the problem. Yes, it looks like its only getting the correct unit after displaying the graph. Which is why the second press is displaying the correct unit. Leave it with me.
"UI is the saddle, the stirrups, & the reins. UX is the feeling you get being able to ride the horse."
User avatar
Sjonnie2017
Posts: 361
Joined: Wednesday 02 August 2017 19:43
Target OS: Linux
Domoticz version: Latest ß
Location: The Netherlands
Contact:

Re: Multiple sources in one graph

Post by Sjonnie2017 »

It is nice to be able to assist :) I have the coding skills of a Kangaroo so if I can contribute by testing I am more than happy to do so.

Greetz,

Sjonnie
ConBee II - TRÅDFRI lights + switches, loads of ChingLing dimmers and switches, Heiman and Xiaomi sensors
SolarEdge SE4000H (with active modbus_tcp)
YouLess Energy meter
Shelly 2.5 in roller shutter mode
User avatar
clinkadink
Posts: 417
Joined: Tuesday 31 December 2019 1:15
Target OS: Linux
Domoticz version: 2020.2
Location: Swindon, UK
Contact:

Re: Multiple sources in one graph

Post by clinkadink »

There was an update to the latest beta this morning. It included tooltip styling.

Standard:
Image

Tooltip Styling:
Image

By default, this is disabled. To enable it, add this to your graph block config:

Code: Select all

toolTipStyle: true,
It is obviously still a beta, so any feedback is appreciated ;)
"UI is the saddle, the stirrups, & the reins. UX is the feeling you get being able to ride the horse."
User avatar
clinkadink
Posts: 417
Joined: Tuesday 31 December 2019 1:15
Target OS: Linux
Domoticz version: 2020.2
Location: Swindon, UK
Contact:

Re: Multiple sources in one graph

Post by clinkadink »

Sjonnie2017 wrote: Sunday 16 February 2020 13:58 It is nice to be able to assist :) I have the coding skills of a Kangaroo so if I can contribute by testing I am more than happy to do so.
I am relying on folks like you to test, so many thanks! :)
"UI is the saddle, the stirrups, & the reins. UX is the feeling you get being able to ride the horse."
Post Reply

Who is online

Users browsing this forum: No registered users and 0 guests