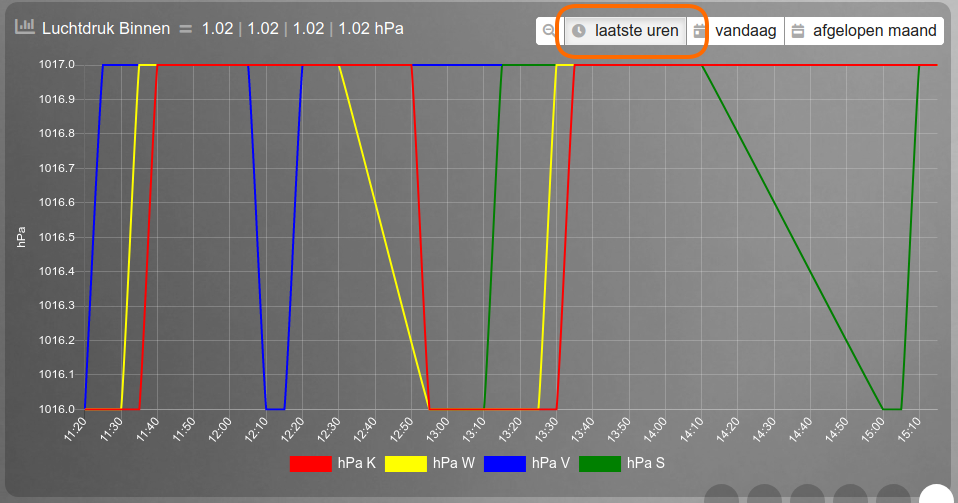
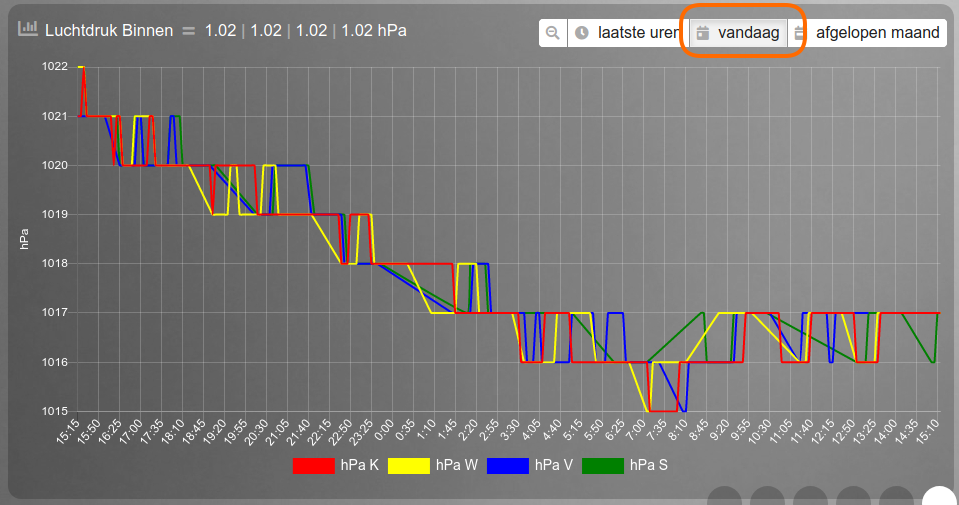
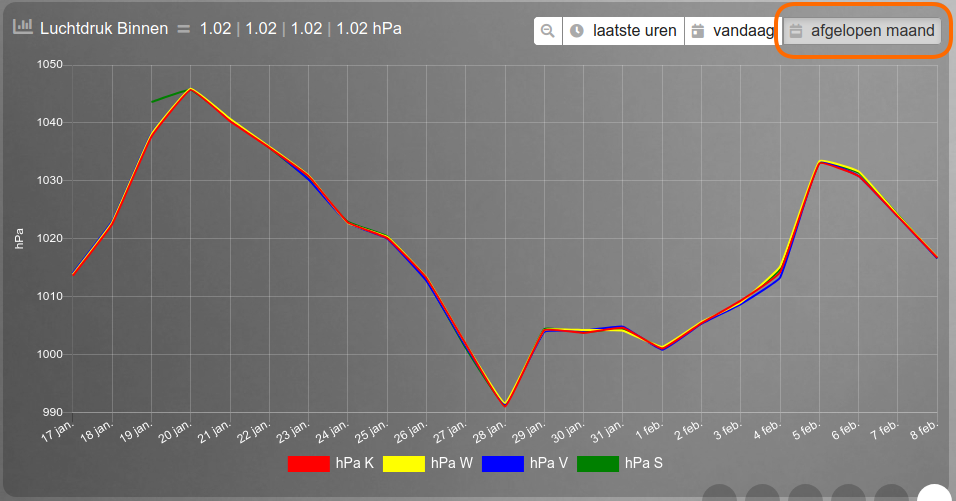
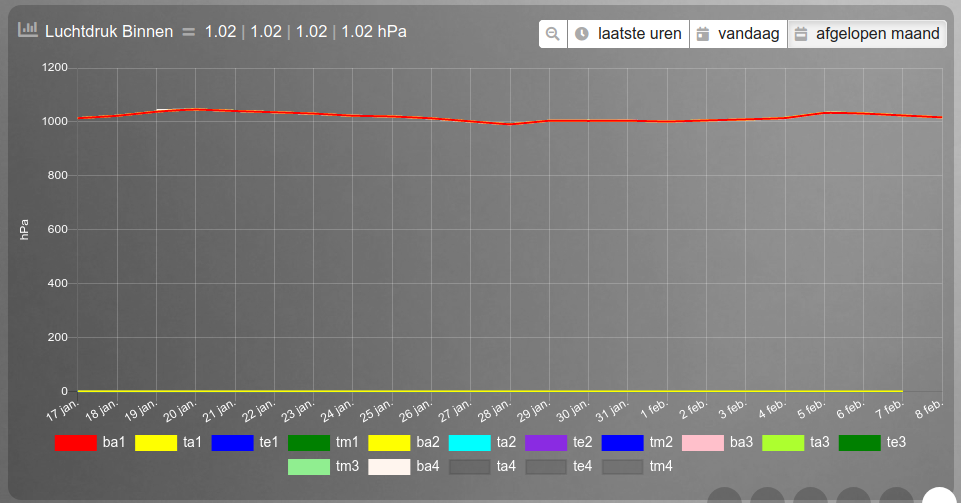
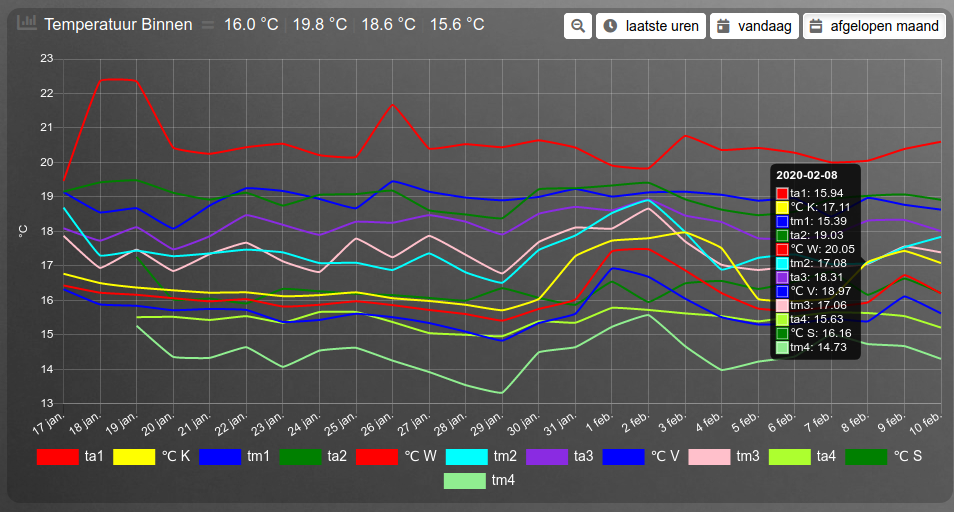
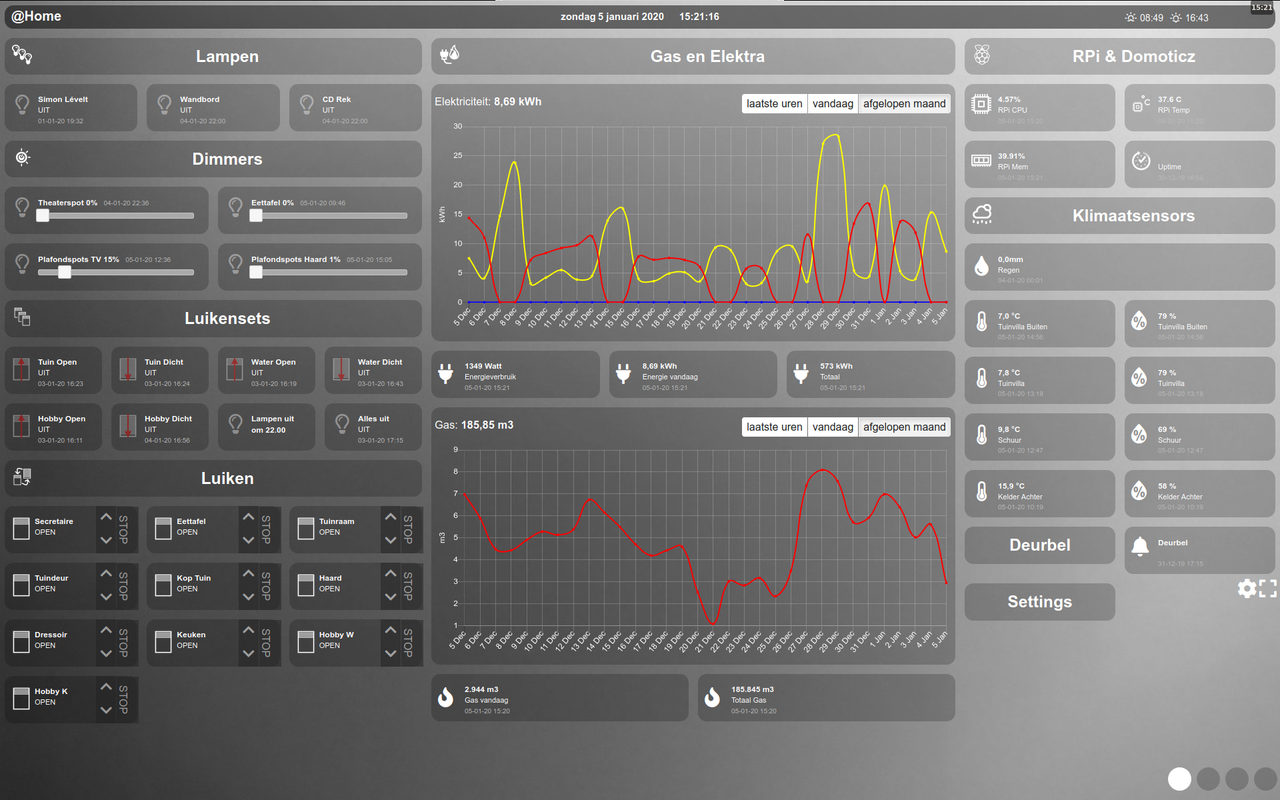
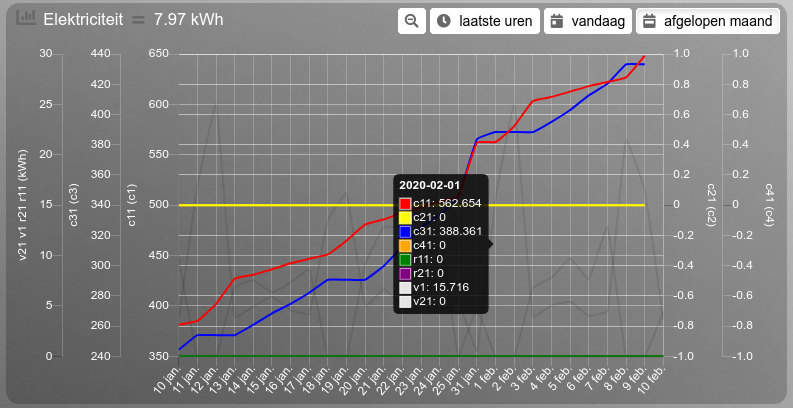
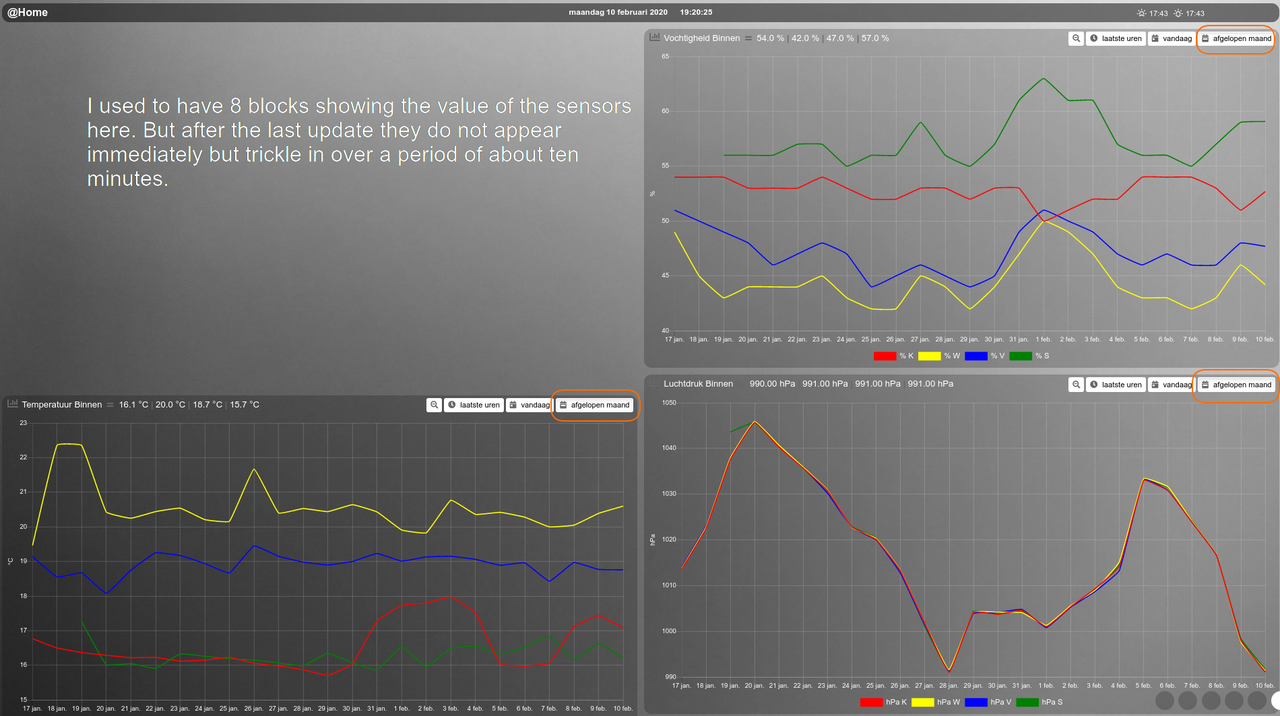
Been experimenting yesterday with a multitude of settings to get the colors in the different graphs the same. I didn't succeed but I think I have found the source of my "problem"
I created a datasetColor for all 12 readings for temperature. Disabled filtering several readings and set Legend to true.
Reading -- datasetColor -- desired color
TA1-------- red
TE1-------- yellow
TM1-------- blue
TA2-------- green
TE2-------- beige
TM2-------- aqua
TA3-------- blueviolet
TE3-------- chartreuse
TM3-------- pink
TA4-------- greenyellow
TE4-------- indigo
TM4-------- lightgreen
So with the above datasetColors the graphs for 'last hours' and 'today' look like these:
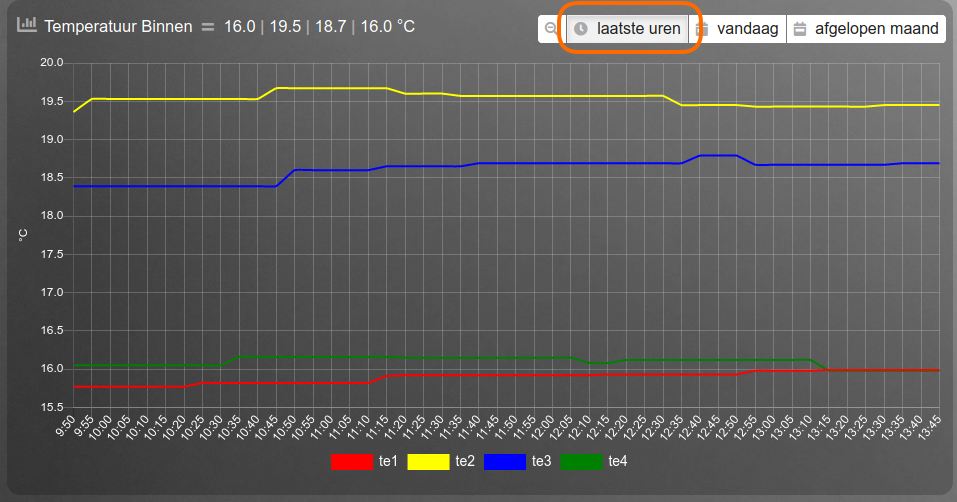
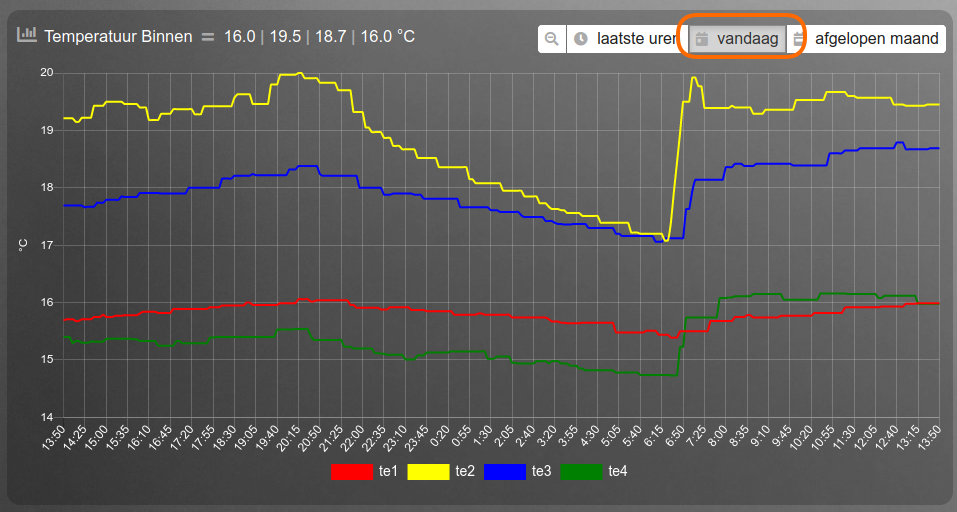
And the graph for last month looks like this:
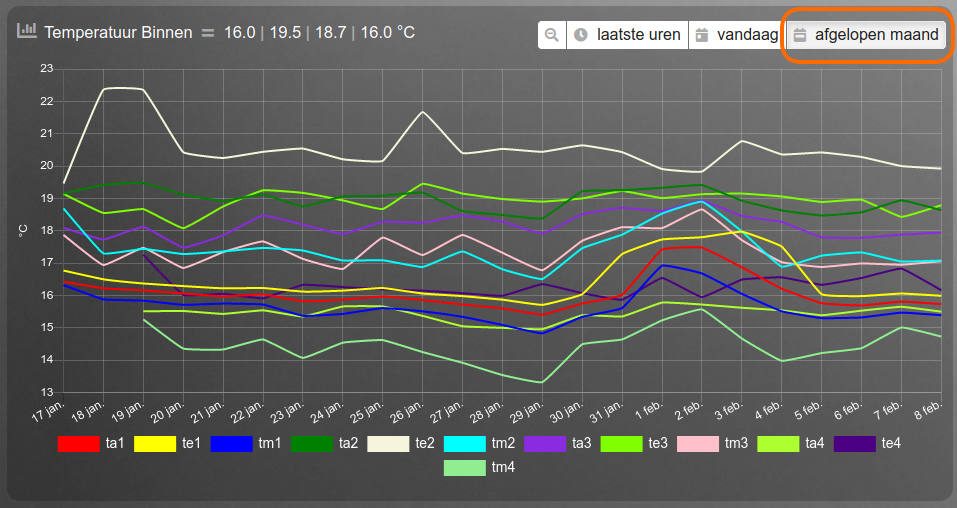
The code I used for above graphs:
Code: Select all
blocks['multigraph_144'] = {
	title: 'Temperatuur Binnen',
        devices: [ 144, 145, 152, 158],
        sortDevices: false,
	datasetColors: ['red', 'yellow', 'blue', 'green', 'beige', 'aqua', 'blueviolet', 'chartreuse', 'pink', 'greenyellow', 'indigo', 'lightgreen', 'seashell'],
	spanGaps: true,
	graph: 'line',
	legend: true
}If I change beige to yellow, chartreuse to blue and indigo to green (and filter the readings) then the better part of the graph for last month is looking fine:
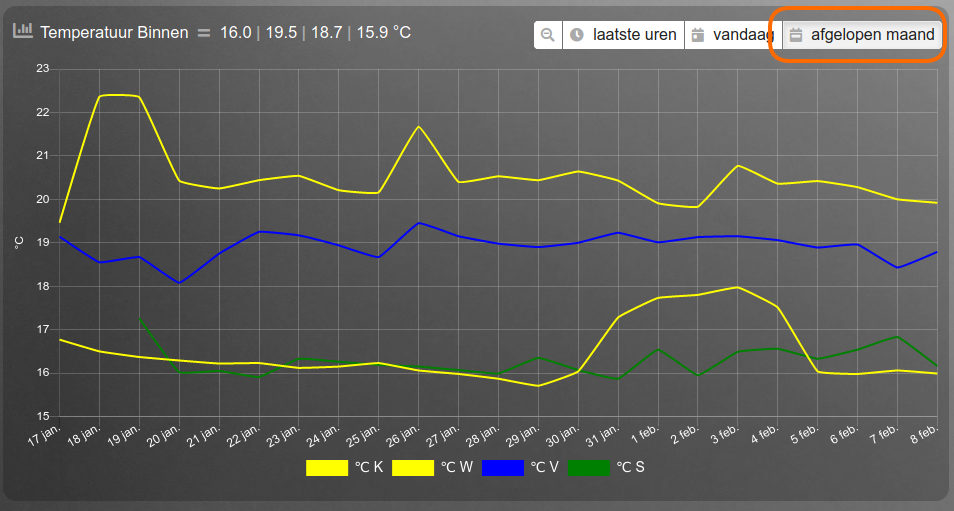
And the code that goes with it:
Code: Select all
blocks['multigraph_144'] = {
	title: 'Temperatuur Binnen',
        devices: [ 144, 145, 152, 158],
        sortDevices: false,
	datasetColors: ['red', 'yellow', 'blue', 'green', 'yellow', 'aqua', 'blueviolet', 'blue', 'pink', 'greenyellow', 'green', 'lightgreen', 'seashell'],
	spanGaps: true,
	graph: 'line',
	legend: {
        'te1': '℃ K',
//	'ta1': '℃ K(avg)',
//	'tm1': '℃ K(min)',
        'te2': '℃ W',
//	'ta2': '℃ W(avg)',
//	'tm2': '℃ W(min)',
	'te3': '℃ V',
//	'ta3': '℃ V(avg)',
//	'tm3': '℃ V(min)',
	'te4': '℃ S'
//	'ta4': '℃ S(avg)',
//	'tm4': '℃ S(min)',
   }
}If anyone has a bright idea how to get tm1 to show up red in my graph without "ruining" the other two graphs I am "all ears"
Greetz,
Sjonnie
