Page 1 of 3
[Experimental] New graph module. Testers needed.
Posted: Friday 23 August 2019 23:17
by Lokonli
I've developed a new graph module. As an example, it can generate graphs like the following:
- P1_custom.JPG (60.98 KiB) Viewed 3532 times
Technical:
I switched from morris.js to chart.js for creating the graphs and added some functionality.
The module is still a bit experimental, and not completely backwards compatible. But I think the new functionality is worth the effort for making the change.
I would like to ask you to help by testing this branch, and to leave your feedback here in this topic.
Documentation
https://dashticz.readthedocs.io/en/char ... raphs.html
Priorities
1. Stability/bug fixes
2. Ease-of-use. Default behavior as good as possible, to minimize the need for configuration settings
3. Basic styling
4. Extension of configuration possibilities, functionality, styling
Installation
The functionality is available via a separate branch 'chartjs':
https://github.com/Dashticz/dashticz/tree/chartjs
If you've used git clone or the automatic installation script it should be pretty easy to switch to this branch:
You can switch back to the beta branch via:
If you start making changes in your CONFIG.js to test the graph functionality I would recommend to make a backup of CONFIG.js first.
I cannot guarantee that the configuration settings will not changes in future updates of the graph functionality. It should be stable after I have merged it into beta.
For most users it should work out-of-the-box without changing any setting, although the charts will look differently.
If the functionality is stable enough I'll merge it into Beta, and some time later into Master.
Thanks for your help, and enjoy

Re: [Experimental] New graph module. Testers needed.
Posted: Saturday 24 August 2019 8:37
by renerene
thank you very much. Will look into it very soon. Looks promising.
just to be sure, before ´git fetch´ there is ´cd dashticz´?
Re: [Experimental] New graph module. Testers needed.
Posted: Saturday 24 August 2019 10:06
by Lokonli
Yes
Sent from my SM-A320FL using Tapatalk
Re: [Experimental] New graph module. Testers needed.
Posted: Saturday 24 August 2019 11:49
by EdwinK
git fetch
root@DiskStation:/volume1/web/dashboard# git checkout chartjs
error: pathspec 'chartjs' did not match any file(s) known to git
Re: [Experimental] New graph module. Testers needed.
Posted: Saturday 24 August 2019 12:09
by renerene
Working, Looks great!
git fetch: no problem (was already on dashticz 3)
first, my graphs were gone, with the initial custom.js .
But after I removed the declarations like
Code: Select all
blocks['graph_428'] = {
   title: 'Gas',
   width: 6,
};
.. the graphs were back, with no data
After modifying to
Code: Select all
/*	zonnepaneel	Growatt*/
blocks['graph_1354'] = {
    type: 'bar',
    datasetColors: ['yellow']
};


/*	P1 power gas*/
blocks['graph_428'] = {
    type: 'bar',
    datasetColors: ['yellow']
};

/*	P1 power stroom*/
blocks['graph_427'] = {
    width:6
    title: 'My Power',
    graph: ['line','bar','bar'],
    custom : {
        "last day": {
            range: 'day',
            filter: '8 hours',
            data: {
                nett: 'd.v+d.v2-d.r1-d.r2',
                usage: 'd.v+d.v2',
                generation: '-d.r1-d.r2'
            }
        },
        "last 2 weeks": {
            range: 'month',
            filter: '14 days',
            data: {
                nett: 'd.v+d.v2-d.r1-d.r2',
                usage: 'd.v+d.v2',
                generation: '-d.r1-d.r2'
            }
        },
        "last 6 months": {
            range: 'year',
            filter: '6 months',
            data: {
                nett: 'd.v+d.v2-d.r1-d.r2',
                usage: 'd.v+d.v2',
                generation: '-d.r1-d.r2'
            }
        }
    },
    legend: true,
    datasetColors:['blue','red','yellow']
}
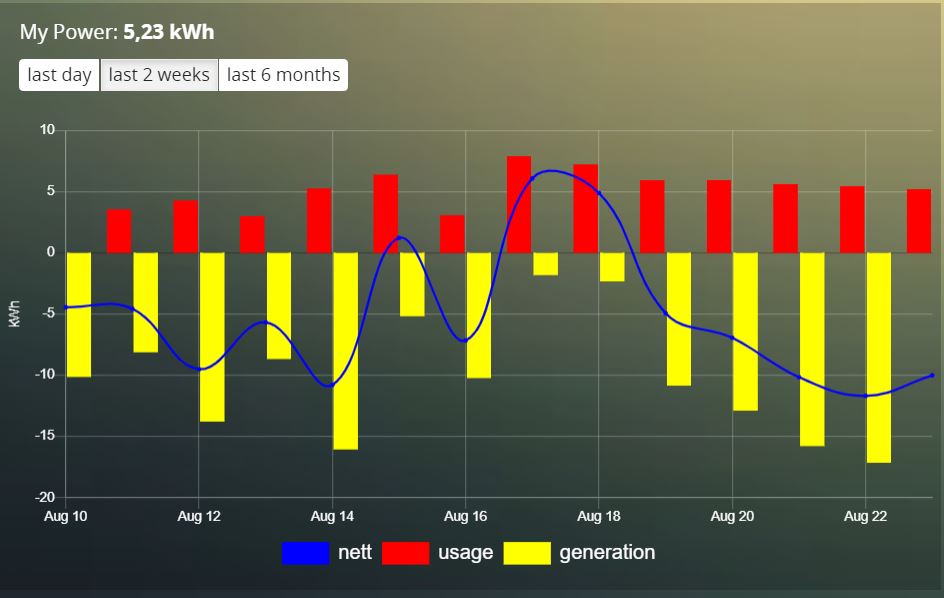
result:

Now time for fine tune, looking for a way to change size... let's see....
Re: [Experimental] New graph module. Testers needed.
Posted: Saturday 24 August 2019 13:04
by Lokonli
renerene wrote: Saturday 24 August 2019 12:09
Working, Looks great!
git fetch: no problem (was already on dashticz 3)
first, my graphs were gone, with the initial custom.js .
But after I removed the declarations like
Code: Select all
blocks['graph_428'] = {
   title: 'Gas',
   width: 6,
};
.. the graphs were back, with no data
After modifying to
Code: Select all
/*	zonnepaneel	Growatt*/
blocks['graph_1354'] = {
    type: 'bar',
    datasetColors: ['yellow']
};


/*	P1 power gas*/
blocks['graph_428'] = {
    type: 'bar',
    datasetColors: ['yellow']
};

/*	P1 power stroom*/
blocks['graph_427'] = {
    width:6
    title: 'My Power',
    graph: ['line','bar','bar'],
    custom : {
        "last day": {
            range: 'day',
            filter: '8 hours',
            data: {
                nett: 'd.v+d.v2-d.r1-d.r2',
                usage: 'd.v+d.v2',
                generation: '-d.r1-d.r2'
            }
        },
        "last 2 weeks": {
            range: 'month',
            filter: '14 days',
            data: {
                nett: 'd.v+d.v2-d.r1-d.r2',
                usage: 'd.v+d.v2',
                generation: '-d.r1-d.r2'
            }
        },
        "last 6 months": {
            range: 'year',
            filter: '6 months',
            data: {
                nett: 'd.v+d.v2-d.r1-d.r2',
                usage: 'd.v+d.v2',
                generation: '-d.r1-d.r2'
            }
        }
    },
    legend: true,
    datasetColors:['blue','red','yellow']
}
result:
Now time for fine tune, looking for a way to change size... let's see....
Thanks.
There was indeed a bug in the width parameter.
It's fixed
You can update your branch with
Re: [Experimental] New graph module. Testers needed.
Posted: Saturday 24 August 2019 13:09
by Lokonli
EdwinK wrote: Saturday 24 August 2019 11:49
git fetch
root@DiskStation:/volume1/web/dashboard# git checkout chartjs
error: pathspec 'chartjs' did not match any file(s) known to git
Are you using the correct repository? It should be:
https://github.com/Dashticz/dashticz
Did you use git clone or the installation script? If you just downloaded a release then the git settings are not defined.
You can check with:
Code: Select all
#go to your dashticz folder
cd dashticz
git remote -v
This should show:
Code: Select all
origin	http://github.com/Dashticz/dashticz (fetch)
origin	http://github.com/Dashticz/dashticz (push)
Re: [Experimental] New graph module. Testers needed.
Posted: Saturday 24 August 2019 13:35
by EdwinK
Re: [Experimental] New graph module. Testers needed.
Posted: Saturday 24 August 2019 13:53
by renerene
thank you for correcting width option.
How can I allign the height? Both graphics have width=6 in screenshot:

Re: [Experimental] New graph module. Testers needed.
Posted: Saturday 24 August 2019 13:56
by Lokonli
renerene wrote: Saturday 24 August 2019 13:53
thank you for correcting width option.
How can I allign the height? Both graphics have width=6 in screenshot:
Can you show how you defined your graphs? Did you use different width parameters?
Re: [Experimental] New graph module. Testers needed.
Posted: Saturday 24 August 2019 14:03
by Lokonli
EdwinK wrote: Saturday 24 August 2019 13:35
Aaah.. I see now.
You pulled Dashticz from it's previous location.
You can change origin with:
Code: Select all
git remote set-url origin https://github.com/Dashticz/dashticz.git
Check with:
Followed with:
Code: Select all
git fetch origin
git checkout chartjs
Re: [Experimental] New graph module. Testers needed.
Posted: Saturday 24 August 2019 14:15
by renerene
Can you show how you defined your graphs? Did you use different width parameters?
In the screenshot above the width was 5 and 6. However, same height difference with width 6 and 6
Code: Select all
/*	P1 power gas*/
blocks['graph_428'] = {
    type: 'line',
    datasetColors: ['white'],
    width:6
};

/*	P1 power stroom*/
blocks['graph_427'] = {
    width: 6,
    title: 'My Power',
    graph: ['line','bar','bar'],
    custom : {
        "last day": {
            range: '8 hrs',
            filter: '8 hours',
            data: {
                nett: 'd.v+d.v2-d.r1-d.r2',
                usage: 'd.v+d.v2',
                generation: '-d.r1-d.r2'
            }
        },
        "last 2 weeks": {
            range: 'month',
            filter: '14 days',
            data: {
                nett: 'd.v+d.v2-d.r1-d.r2',
                usage: 'd.v+d.v2',
                generation: '-d.r1-d.r2'
            }
        },
        "last 6 months": {
            range: 'year',
            filter: '6 months',
            data: {
                nett: 'd.v+d.v2-d.r1-d.r2',
                usage: 'd.v+d.v2',
                generation: '-d.r1-d.r2'
            }
        }
    },
    legend: false,
    datasetColors:['blue','red','yellow']
}
and
Code: Select all
columns[3]['blocks'] = ['graph_427','graph_428','stationclock', frames.weather,'garbage',779,781,'s2','s3','s4', 866, 941, 1352, 1342, 864, 774, 1137, 1225];
Custom.css has no effect:

Re: [Experimental] New graph module. Testers needed.
Posted: Saturday 24 August 2019 14:16
by renerene
additional: regarding the total amount in the top left corder. It would be great it that would show the total of the selected time interval, not of beginning of measurement/?/year
Re: [Experimental] New graph module. Testers needed.
Posted: Saturday 24 August 2019 17:34
by Lokonli
The width parameter is indeed not applied correctly. I'll fix it within a few days.
Sent from my SM-A320FL using Tapatalk
Re: [Experimental] New graph module. Testers needed.
Posted: Saturday 24 August 2019 17:37
by Lokonli
renerene wrote:additional: regarding the total amount in the top left corder. It would be great it that would show the total of the selected time interval, not of beginning of measurement/?/year
Currently it shows the current value of the device. I'll think of a way how to make it configurable as well.
Sent from my SM-A320FL using Tapatalk
Re: [Experimental] New graph module. Testers needed.
Posted: Tuesday 27 August 2019 23:22
by Lokonli
I've made some updates to the chartjs branch.
The width parameter should now work correctly.
The height of the graph probably will not be the same as before. You can set the height via the height parameter in the block definition.
To update:
Code: Select all
git fetch origin
git checkout chartjs
git pull
or, if you are already on the chartjs branch:
Re: [Experimental] New graph module. Testers needed.
Posted: Wednesday 28 August 2019 8:20
by renerene
Thank you for the update. Did a quick check, the graphs have the same height now.
Furthermore:
1) when is the graph updated? Sometimes the last data is more than 10 minutes old. (never quite understood the config['domoticz_refresh'] = '5';
config['dashticz_refresh'] = '60'. Is it in seconds?)
2) is it possible to combine more devices in one graph? Would be great to build one big mother graph with temp inside, temp outside, electricity, solar, gas
Really thankful with your works uptil now. Keep it up.
Re: [Experimental] New graph module. Testers needed.
Posted: Wednesday 28 August 2019 11:53
by Lokonli
renerene wrote: Wednesday 28 August 2019 8:20
Thank you for the update. Did a quick check, the graphs have the same height now.
Furthermore:
1) when is the graph updated? Sometimes the last data is more than 10 minutes old. (never quite understood the config['domoticz_refresh'] = '5';
config['dashticz_refresh'] = '60'. Is it in seconds?)
2) is it possible to combine more devices in one graph? Would be great to build one big mother graph with temp inside, temp outside, electricity, solar, gas
Really thankful with your works uptil now. Keep it up.
1) Domotics_refresh is the refresh rate for the Domoticz device information, in seconds.
Dashticz_refresh is the reload of the whole dashboard, in minutes.
Currently the graph refresh rate is disabled (in fact it is 5000 minutes ...) . It will become 5 minutes in the next update. This is also the frequency on which Domoticz updates the graph data. (A faster refresh in dashticz doesn't make sense)
2) Yes, nice enhancement. I will add it to the feature request list. It will be quite some work to implement it.
Re: [Experimental] New graph module. Testers needed.
Posted: Wednesday 28 August 2019 20:12
by Lokonli
New version:
graph height now scales with the graph width, limited to the screen height.
Tooltips will be shown when you touch the graph anywhere.
Refresh rate 5 minutes.
Re: [Experimental] New graph module. Testers needed.
Posted: Thursday 29 August 2019 22:19
by Gianni
update to v 3.0.6
get the newest graph.js
add some colors to my js and everything works fine
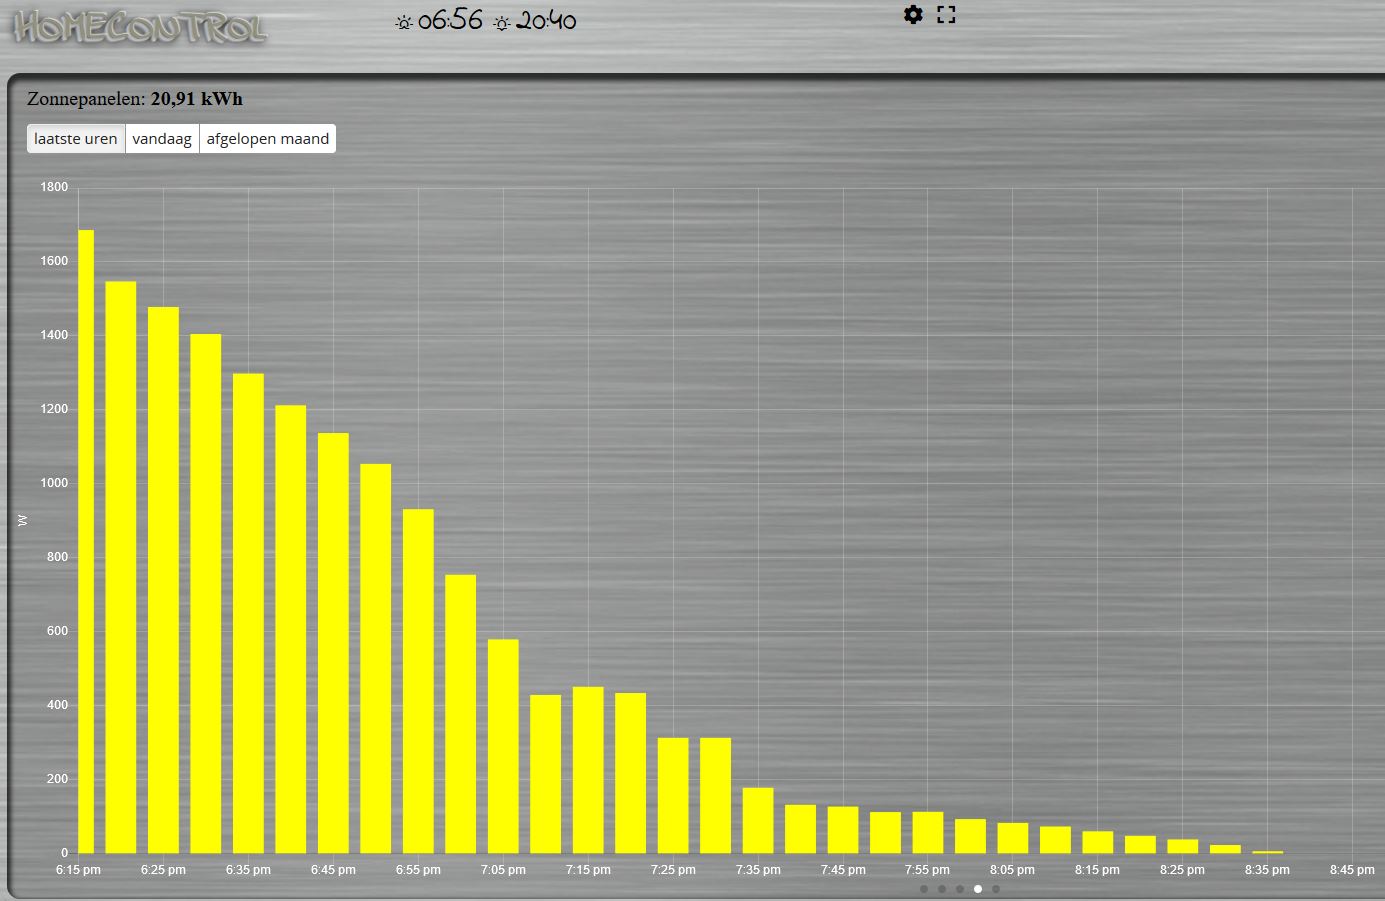
- Knipsel.JPG (143.74 KiB) Viewed 3225 times
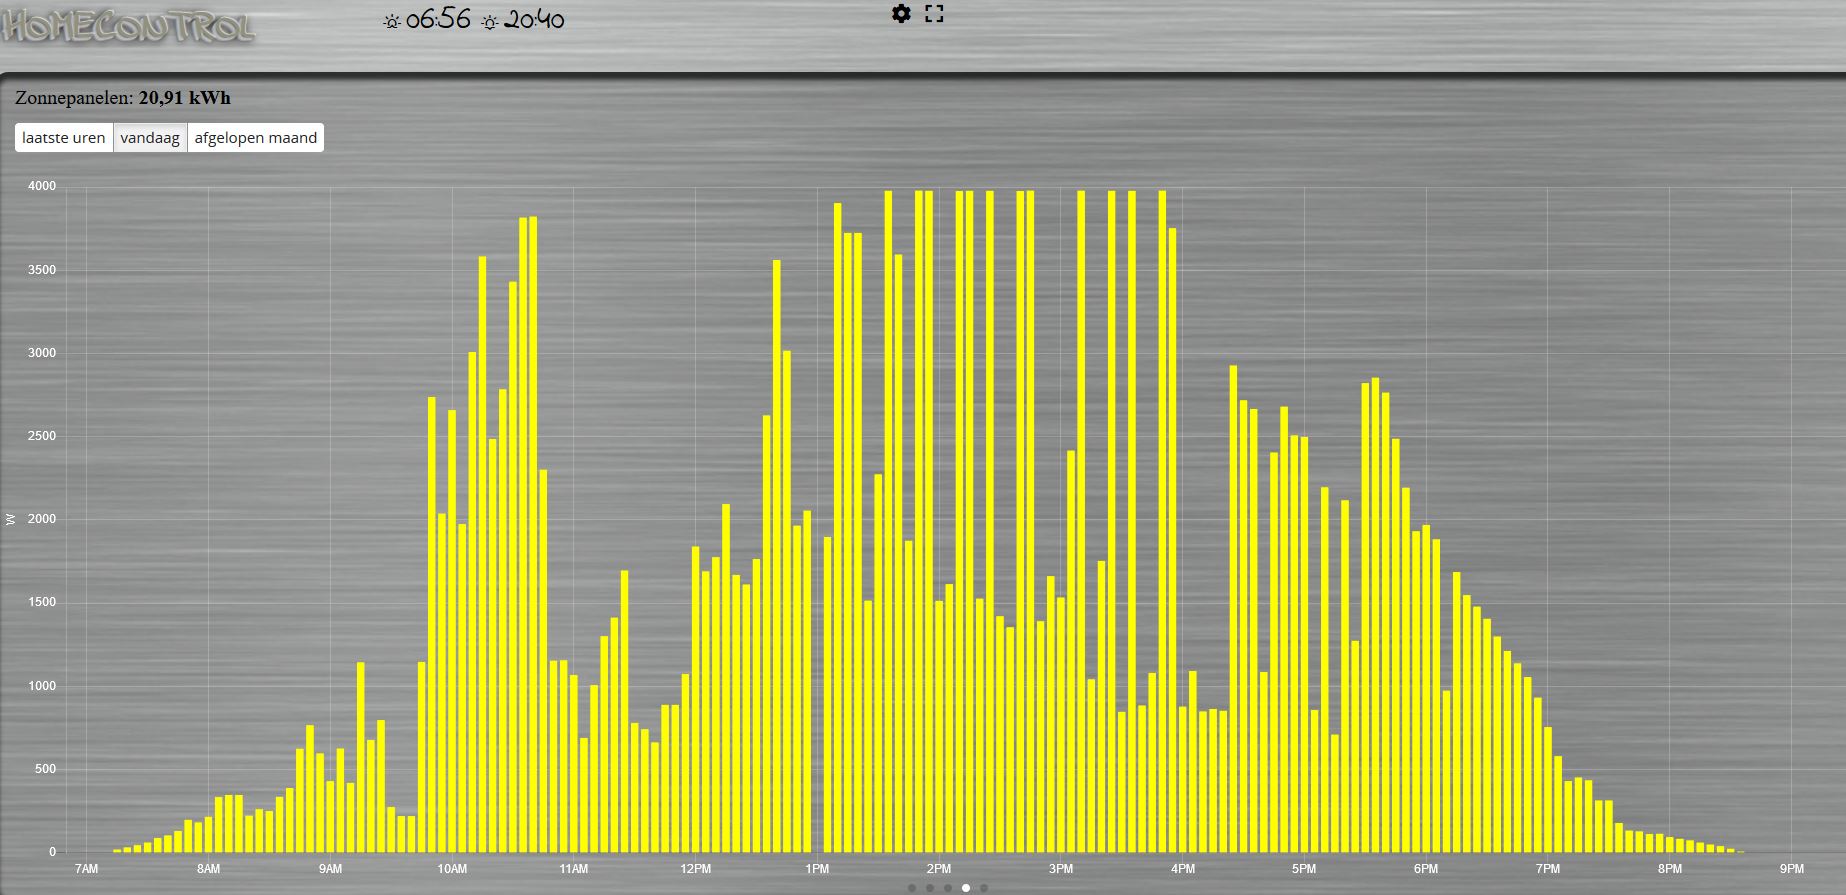
- Knipsel1.JPG (237.44 KiB) Viewed 3225 times
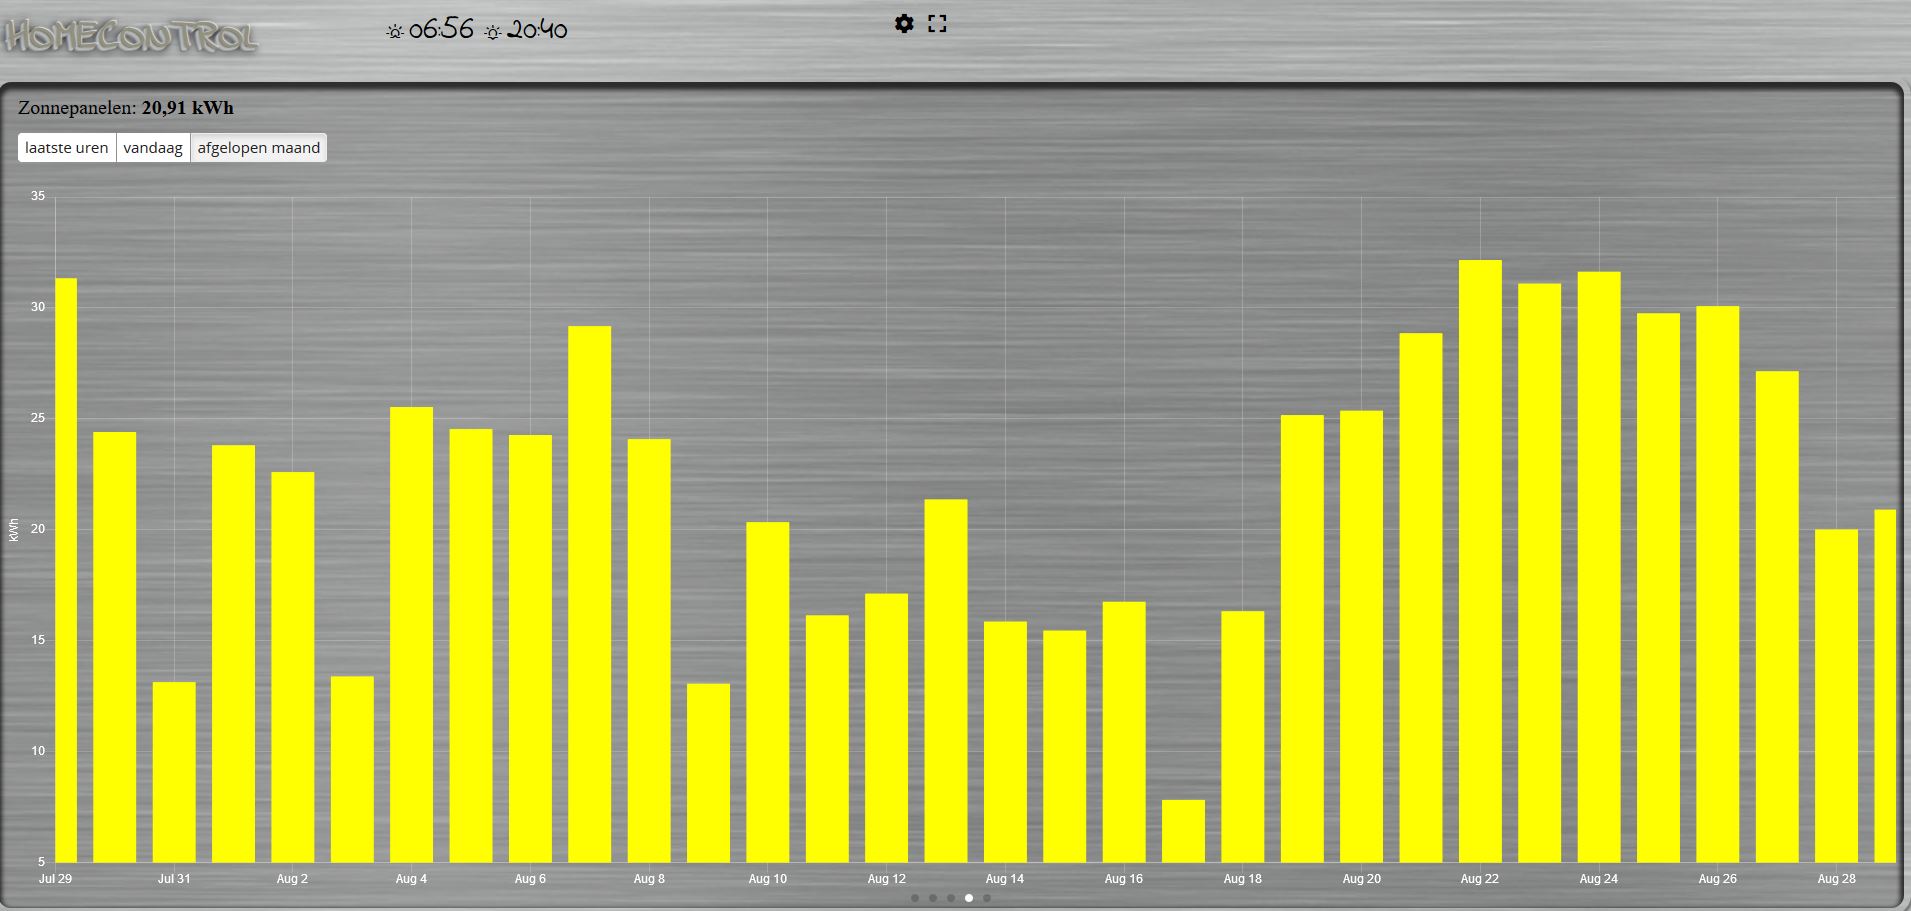
- Knipsel2.JPG (183.42 KiB) Viewed 3225 times