Re: Multiple sources in one graph
Posted: Sunday 23 February 2020 15:06
I don’t need the current values in the header. So a new property would be great.
Open source Home Automation System
https://forum.domoticz.com/


Please could you add "debugButton: true" to the graph block, save, refresh the browser, press the debug button above the graph, and provide a screenshot of the debug window. Thanks.
Code: Select all
{
  "blockId": "block_6",
  "block": {
    "devices": [
      9
    ],
    "datasetColors": [
      "rgba(255, 61, 61, 0.8)",
      "rgba(50, 180, 250, 0.8)"
    ],
    "barWidth": 0.9,
    "beginAtZero": false,
    "borderColors": [
      "rgba(255, 61, 61, 0.8)",
      "rgba(50, 180, 250, 0.8)"
    ],
    "borderDash": [],
    "borderWidth": 2,
    "buttonsBorder": "white",
    "buttonsColor": "black",
    "buttonsFill": "white",
    "buttonsIcon": "#686868",
    "buttonsMarginX": 2,
    "buttonsMarginY": 0,
    "buttonsPadX": 6,
    "buttonsPadY": 2,
    "buttonsRadius": 0,
    "buttonsShadow": false,
    "buttonsSize": 10,
    "buttonsText": false,
    "cartesian": "linear",
    "custom": {
      "vandaag": {
        "range": "day",
        "groupBy": "hour",
        "filter": "24 hours",
        "data": {
          "Temperatuur": "d.te_9",
          "Luchtvochtigheid": "d.hu_9"
        }
      },
      "week": {
        "range": "month",
        "groupBy": "day",
        "filter": "7 days",
        "data": {
          "Temperatuur": "d.te_9",
          "Luchtvochtigheid": "d.hu_9"
        },
        "options": {
          "scales": {
            "yAxes": [
              {
                "ticks": {
                  "fontColor": "rgba(255,255,255,0.4)",
                  "fontSize": 11,
                  "fontFamily": "open-sans"
                },
                "gridLines": {
                  "zeroLineWidth": 1,
                  "zeroLineColor": "rgba(255,255,255,0.4)"
                },
                "scaleLabel": {
                  "fontColor": "rgba(255,255,255,0.4)",
                  "fontSize": 11,
                  "labelString": "°C"
                }
              },
              {
                "ticks": {
                  "fontColor": "rgba(255,255,255,0.4)",
                  "fontSize": 11,
                  "fontFamily": "open-sans"
                },
                "gridLines": {
                  "zeroLineWidth": 1,
                  "zeroLineColor": "rgba(255,255,255,0.4)"
                },
                "scaleLabel": {
                  "fontColor": "rgba(255,255,255,0.4)",
                  "fontSize": 11,
                  "labelString": "%"
                }
              }
            ],
            "xAxes": [
              {
                "ticks": {
                  "fontColor": "rgba(255,255,255,0.2)",
                  "fontSize": 10,
                  "fontFamily": "open-sans"
                },
                "gridLines": {
                  "display": false
                }
              }
            ]
          }
        }
      },
      "maand": {
        "range": "month",
        "groupBy": "week",
        "data": {
          "Temperatuur": "d.te_9",
          "Luchtvochtigheid": "d.hu_9"
        },
        "options": {
          "scales": {
            "yAxes": [
              {
                "ticks": {
                  "fontColor": "rgba(255,255,255,0.4)",
                  "fontSize": 11,
                  "fontFamily": "open-sans"
                },
                "gridLines": {
                  "zeroLineWidth": 1,
                  "zeroLineColor": "rgba(255,255,255,0.4)"
                },
                "scaleLabel": {
                  "fontColor": "rgba(255,255,255,0.4)",
                  "fontSize": 11,
                  "labelString": "°C"
                }
              },
              {
                "ticks": {
                  "fontColor": "rgba(255,255,255,0.4)",
                  "fontSize": 11,
                  "fontFamily": "open-sans"
                },
                "gridLines": {
                  "zeroLineWidth": 1,
                  "zeroLineColor": "rgba(255,255,255,0.4)"
                },
                "scaleLabel": {
                  "fontColor": "rgba(255,255,255,0.4)",
                  "fontSize": 11,
                  "labelString": "%"
                }
              }
            ],
            "xAxes": [
              {
                "ticks": {
                  "fontColor": "rgba(255,255,255,0.2)",
                  "fontSize": 10,
                  "fontFamily": "open-sans"
                },
                "gridLines": {
                  "display": false
                }
              }
            ]
          }
        }
      }
    },
    "debugButton": true,
    "displayFormats": false,
    "drawOrderDay": false,
    "drawOrderLast": false,
    "drawOrderMonth": false,
    "gradients": false,
    "graph": "line",
    "graphTypes": [
      "te",
      "hu"
    ],
    "groupBy": false,
    "height": "300px",
    "iconColour": "grey",
    "interval": 1,
    "legend": false,
    "lineFill": false,
    "lineTension": 0.3,
    "maxTicksLimit": null,
    "method": 1,
    "pointBorderColor": [
      "grey"
    ],
    "pointBorderWidth": 0,
    "pointFillColor": [
      "rgba(255, 61, 61, 0.8)",
      "rgba(50, 180, 250, 0.8)"
    ],
    "pointRadius": 0,
    "pointStyle": false,
    "reverseTime": false,
    "sortDevices": false,
    "spanGaps": false,
    "title": "Binnenklimaat",
    "toolTipStyle": false,
    "width": 12,
    "zoom": "x"
  },
  "currentValue": "18.2 C, 58 %",
  "currentValues": [
    "18.2 °C"
  ],
  "customRange": true,
  "data": {
    "result": [
      {
        "d": "2020-02-23 18:00",
        "hu_9": 31.043478260869566,
        "te_9": 10.041739130434784
      },
      {
        "d": "2020-02-23 19:00",
        "hu_9": 31.217391304347824,
        "te_9": 9.774782608695652
      },
      {
        "d": "2020-02-23 20:00",
        "hu_9": 30.26086956521739,
        "te_9": 9.781739130434783
      },
      {
        "d": "2020-02-23 21:00",
        "hu_9": 30.26086956521739,
        "te_9": 9.77826086956522
      },
      {
        "d": "2020-02-23 22:00",
        "hu_9": 30.26086956521739,
        "te_9": 9.64173913043478
      },
      {
        "d": "2020-02-23 23:00",
        "hu_9": 30.26086956521739,
        "te_9": 9.318260869565218
      },
      {
        "d": "2020-02-24 00:00",
        "hu_9": 30.26086956521739,
        "te_9": 9.04826086956522
      },
      {
        "d": "2020-02-24 01:00",
        "hu_9": 30.38095238095238,
        "te_9": 8.831904761904761
      },
      {
        "d": "2020-02-24 02:00",
        "hu_9": 31.636363636363637,
        "te_9": 9.036363636363635
      },
      {
        "d": "2020-02-24 03:00",
        "hu_9": 30.526315789473685,
        "te_9": 8.547368421052632
      },
      {
        "d": "2020-02-24 04:00",
        "hu_9": 31.23076923076923,
        "te_9": 8.475384615384614
      },
      {
        "d": "2020-02-24 05:00",
        "hu_9": 32.22222222222222,
        "te_9": 8.744444444444445
      },
      {
        "d": "2020-02-24 06:00",
        "hu_9": 30.08695652173913,
        "te_9": 8.093478260869565
      },
      {
        "d": "2020-02-24 07:00",
        "hu_9": 28.17391304347826,
        "te_9": 9.005652173913045
      },
      {
        "d": "2020-02-24 08:00",
        "hu_9": 28.17391304347826,
        "te_9": 9.350434782608694
      },
      {
        "d": "2020-02-24 09:00",
        "hu_9": 28.17391304347826,
        "te_9": 9.516521739130438
      },
      {
        "d": "2020-02-24 10:00",
        "hu_9": 28.17391304347826,
        "te_9": 9.388695652173913
      },
      {
        "d": "2020-02-24 11:00",
        "hu_9": 29.130434782608695,
        "te_9": 9.25391304347826
      },
      {
        "d": "2020-02-24 12:00",
        "hu_9": 28.52173913043478,
        "te_9": 9.573913043478262
      },
      {
        "d": "2020-02-24 13:00",
        "hu_9": 28.434782608695652,
        "te_9": 9.786521739130436
      },
      {
        "d": "2020-02-24 14:00",
        "hu_9": 29.217391304347824,
        "te_9": 9.54782608695652
      },
      {
        "d": "2020-02-24 15:00",
        "hu_9": 29.565217391304348,
        "te_9": 9.516521739130436
      },
      {
        "d": "2020-02-24 16:00",
        "hu_9": 30.26086956521739,
        "te_9": 9.527826086956523
      }
    ],
    "status": "OK",
    "title": "Graph day",
    "Temperatuur": "d.te_9",
    "Luchtvochtigheid": "d.hu_9"
  },
  "dataFilterCount": 24,
  "dataFilterUnit": "hours",
  "decimals": 1,
  "forced": false,
  "graphConfig": {
    "range": "day",
    "groupBy": "hour",
    "filter": "24 hours",
    "data": {
      "Temperatuur": "d.te_9",
      "Luchtvochtigheid": "d.hu_9"
    }
  },
  "graphIdx": "block_69",
  "hasBlock": true,
  "idx": 9,
  "lastRefreshTime": 1582560634,
  "mountPoint": "#block_6",
  "multigraph": false,
  "name": "Binnenklimaat",
  "popup": false,
  "primary": true,
  "primaryIdx": "block_69",
  "range": "day",
  "realrange": "day",
  "sensor": "temp",
  "subtype": "WTGR800",
  "title": "Binnenklimaat",
  "txtUnit": "°C",
  "type": "Temp + Humidity",
  "isInitial": true,
  "groupBy": "hour",
  "keys": [
    "hu",
    "te"
  ],
  "ykeys": [
    "Temperatuur",
    "Luchtvochtigheid"
  ],
  "ylabels": [
    "%",
    "°C"
  ],
  "filter": "24 hours"
}Code: Select all
// Gas en elektra
var elektra                    = 199;
var gas                        = 200;
var elektra_nu                 = '199_1';
var elektra_vandaag            = '199_2';
var elektra_totaal             = '199_3';
var grafiek_gas                = 'graph_200';
var grafiek_elektra            = 'graph_199';
Code: Select all
// componenten gas en elektra
//blocks[elektra_nu] = {}
//blocks[elektra_nu]['width'] = 4;
//blocks[elektra_nu]['popup'] = 'popup_elektra_nu';
//blocks[elektra_nu]['show_lastupdate'] = false;
//blocks[elektra_nu]['protected'] = true;

blocks[elektra_nu] = {
	width: 4,
	popup: 'popup_elektra_nu',
	show_lastupdate: false,
}

//blocks['popup_elektra_nu'] = {}
//blocks['popup_ekektra_nu']['title'] = 'Electriciteit';
//blocks['popup_elektra_nu']['devices'] = [199];
//blocks['popup_elektra_nu']['toolTipStyle'] = true;
//blocks['popup_elektra_nu']['datasetColors'] = ['red', 'yellow'];
//blocks['popup_elektra_nu']['graph'] = 'line';
//blocks['popup_elektra_nu']['legend'] = {'v2_199': 'Dag', 'v_199': 'Nacht'}

blocks['popup_elektra_nu'] = {
    title: 'Electriciteit',
    devices: [199],
    toolTipStyle: true,
    datasetColors: ['red', 'yellow'],
    graph: 'line',
    legend: {
        'v_199' : 'Nacht',
        'v2_199': 'Dag',
        'c_199' : 'Totaal'
    }
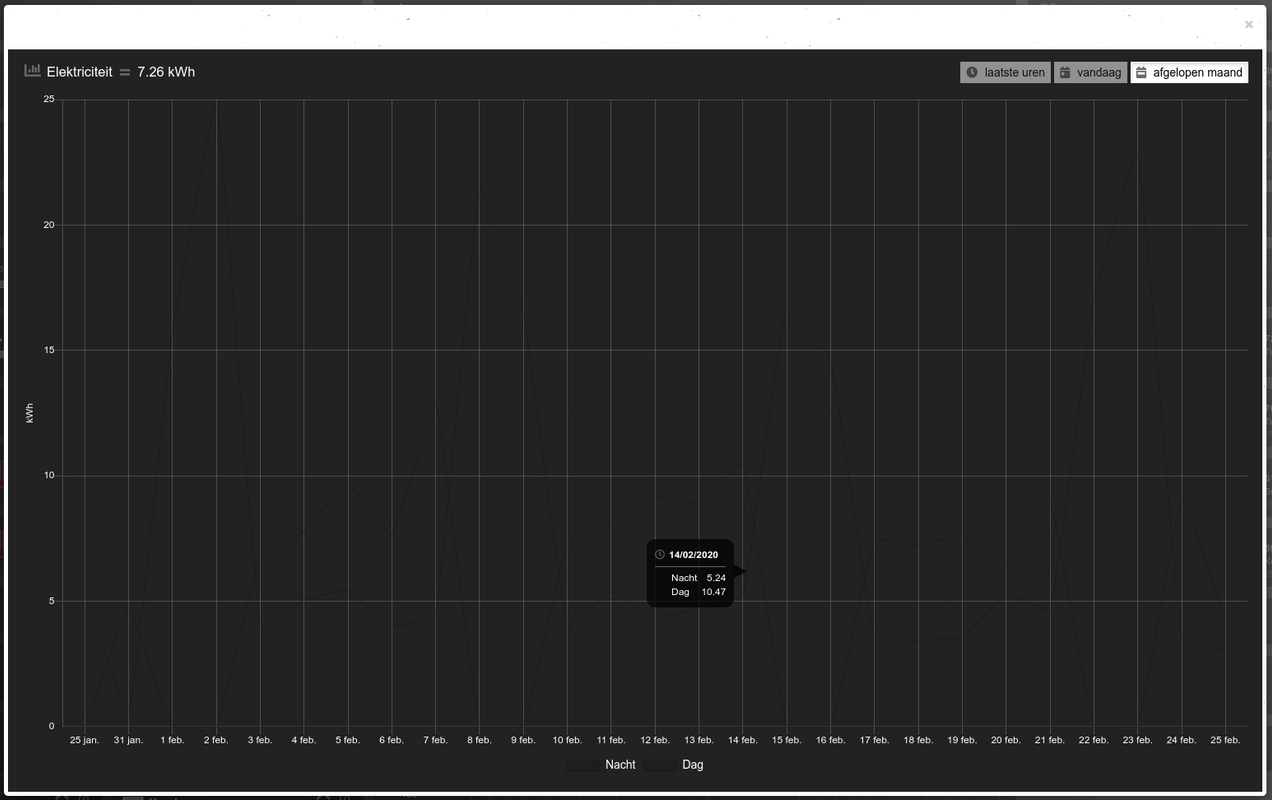
}Did you remove your CSS tooltip styling from the last update? What happens when you click the block? Does any popup show? What happens when you add the popup graph to your column definition? Does it display correctly as a standard graph?Sjonnie2017 wrote: ↑Monday 24 February 2020 19:19 I am having trouble to get the custom popup showing.
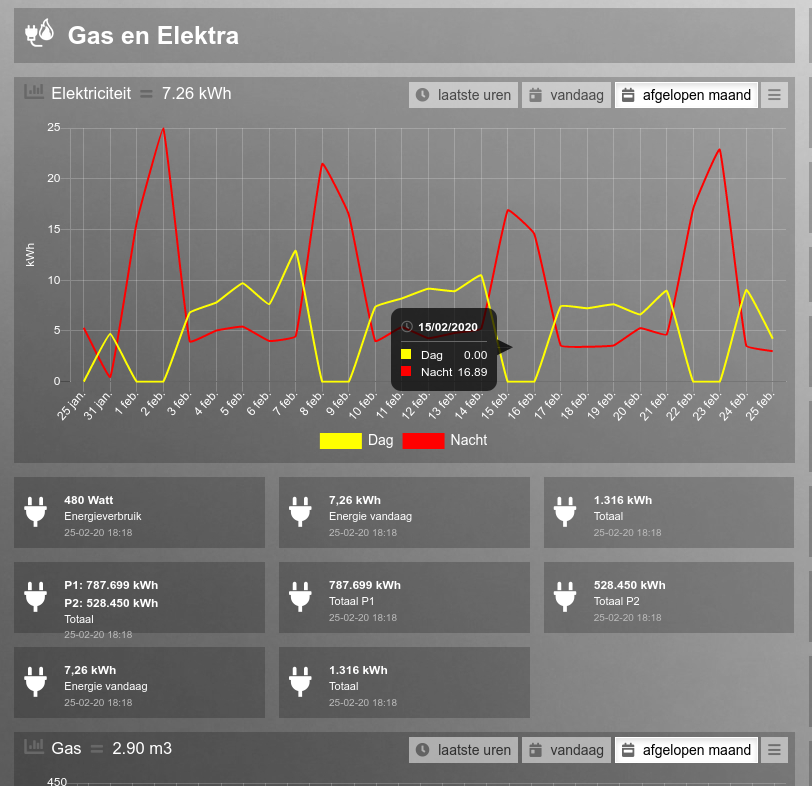
Please try this.Sjonnie2017 wrote: ↑Monday 24 February 2020 19:19 I am having trouble to get the custom popup showing. I tried my own notation (rem'ed out in below sample) and your anotation style. In both cases I am unable to get the popup graph to show up when I click the block "Elektra Nu".


Code: Select all
blocks[199] = {
	width: 4,
	popup: 'popup_elektra_nu',
	//show_lastupdate: false,
}

//blocks['popup_elektra_nu'] = {}
//blocks['popup_ekektra_nu']['title'] = 'Electriciteit';
//blocks['popup_elektra_nu']['devices'] = [199];
//blocks['popup_elektra_nu']['toolTipStyle'] = true;
//blocks['popup_elektra_nu']['datasetColors'] = ['red', 'yellow'];
//blocks['popup_elektra_nu']['graph'] = 'line';
//blocks['popup_elektra_nu']['legend'] = {'v2_199': 'Dag', 'v_199': 'Nacht'}

blocks['popup_elektra_nu'] = {
    title: 'Elektriciteit',
    devices: [199],
    toolTipStyle: true,
    datasetColors: ['red', 'yellow', 'blue'],
    graph: 'line',
    legend: {
        'v_199' : 'Nacht',
        'v2_199': 'Dag',
        'c_199' : 'Totaal'
    }
}Code: Select all
columns[2] = {}
columns[2]['blocks'] = [title_gas_en_elektra, grafiek_elektra, 199, elektra_vandaag, elektra_totaal, grafiek_gas, gas]
columns[2]['width'] = 5;Code: Select all
blocks['popup_elektra_nu'] = {
    title: 'Elektriciteit',
    devices: [199],
    toolTipStyle: true,
    //datasetColors: ['red', 'yellow', 'blue', 'green', 'white', 'orange'],
    datasetColors: ['red', 'yellow', 'blue', 'red', 'yellow', 'aqua', 'red', 'yellow'],
    graph: 'line',
    legend: {
        'v_199' : 'Nacht',
        'v2_199': 'Dag',
        'c_199' : 'Totaal'
    }
}

clinkadink wrote: ↑Monday 24 February 2020 17:49 Thanks for the quick response. I have found the issue and will correct it this evening.
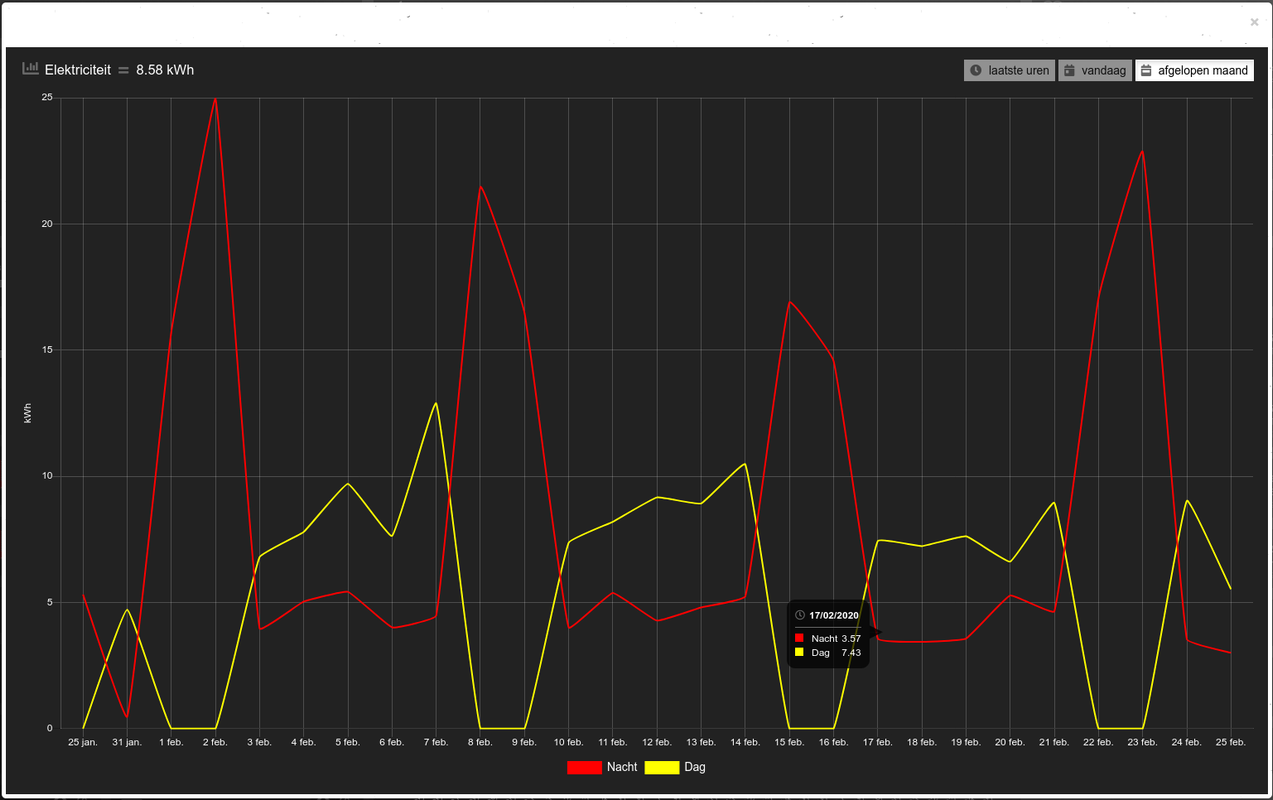
Glad you got it workingSjonnie2017 wrote: ↑Tuesday 25 February 2020 19:54 Ok, that works. I changed the dataset colors as follows:
Great news! Thanks for letting me know
Yes, and that is why I changed it to 199 in my example that I providedSjonnie2017 wrote: ↑Wednesday 26 February 2020 19:29 I think it is caused by the fact that the block refers to IDX 199_1 (for example) and the popup graph uses IDX 199. Could this be the case/cause?
Code: Select all
blocks['graph_9'] = {
  devices: [45,46],
  width: 12,
  zoom: 'x',
  title: 'Binnenklimaat',
  graph: 'line',
  datasetColors: ['rgba(255, 61, 61, 0.8)','rgba(50, 180, 250, 0.8)'],
  borderWidth: 2,
  lineTension: 0.3,
  graphTypes: ['te', 'hu'],
  legend: {
    'te': 'Temperatuur',
    'hu': 'Luchtvochtigheid',
  },
  legend: false,
  buttonsSize: 10,
  custom : {
    "vandaag": {
			range: 'day',
			groupBy: 'hour',
			filter: '12 hours',
      data: {
        Temperatuur: 'd.te_45',
        Luchtvochtigheid: 'd.hu_46',
      },
      options: {
        scales: {
          yAxes: [{
            ticks: {
              min: 10,
              max: 20,
              stepSize: 2,
              fontColor: "rgba(128,128,128,0.4)",
              fontSize: 10,
              fontFamily: 'open-sans',
            },
              gridLines: {
                zeroLineColor: "rgba(128,128,128,0.3)",
								color: "rgba(128,128,128,0.3)",
              },
              scaleLabel: {
                fontColor: "rgba(128,128,128,0.3)",
                fontSize: 11,
                labelString:'°C'
              },
          },
					{
						ticks: {
							min: 50,
							max: 60,
							stepSize: 2,
							fontColor: "rgba(128,128,128,0.4)",
							fontSize: 10,
							fontFamily: 'open-sans',
						},
							gridLines: {
								zeroLineWidth: 1,
                zeroLineColor: "rgba(128,128,128,0.3)",
								color: "rgba(0,0,0,0)",
							},
							scaleLabel: {
								fontColor: "rgba(128,128,128,0.4)",
								fontSize: 11,
								labelString:'%'
							},
					}],
          xAxes: [{
            ticks: {
              fontColor: "rgba(128,128,128,0.4)",
              fontSize: 10,
              fontFamily: 'open-sans',
            },
            gridLines: {
              display: false,
            },
          }]
        }
      },
    },
    "week": {
			range: 'month',
			groupBy: 'day',
			filter: '7 days',
        data: {
					Temperatuur: 'd.te_45',
	        Luchtvochtigheid: 'd.hu_46',
        },
				options: {
	        scales: {
	          yAxes: [{
	            ticks: {
								min: 10,
	              max: 20,
	              stepSize: 2,
	              fontColor: "rgba(128,128,128,0.4)",
	              fontSize: 11,
	              fontFamily: 'open-sans',
	            },
	              gridLines: {
	                zeroLineWidth: 1,
	                zeroLineColor: "rgba(128,128,128,0.4)",
	              },
	              scaleLabel: {
	                fontColor: "rgba(128,128,128,0.4)",
	                fontSize: 11,
	                labelString:'°C'
	              },
	          },
						{
							ticks: {
								min: 50,
								max: 60,
								stepSize: 2,
								fontColor: "rgba(128,128,128,0.4)",
								fontSize: 11,
								fontFamily: 'open-sans',
							},
								gridLines: {
									zeroLineWidth: 1,
									zeroLineColor: "rgba(128,128,128,0.4)",
								},
								scaleLabel: {
									fontColor: "rgba(128,128,128,0.4)",
									fontSize: 11,
									labelString:'%'
								},
						}],
	          xAxes: [{
	            ticks: {
	              fontColor: "rgba(128,128,128,0.4)",
	              fontSize: 10,
	              fontFamily: 'open-sans',
	            },
	            gridLines: {
	              display: false,
	            },
	          }]
	        }
	      },
    },
    "maand": {
			range: 'month',
			groupBy: 'week',
        data: {
					Temperatuur: 'd.te_45',
	        Luchtvochtigheid: 'd.hu_46',
        },
				options: {
	        scales: {
	          yAxes: [{
	            ticks: {
								min: 10,
	              max: 20,
	              stepSize: 2,
	              fontColor: "rgba(128,128,128,0.4)",
	              fontSize: 11,
	              fontFamily: 'open-sans',
	            },
	              gridLines: {
	                zeroLineWidth: 1,
	                zeroLineColor: "rgba(128,128,128,0.4)",
	              },
	              scaleLabel: {
	                fontColor: "rgba(128,128,128,0.4)",
	                fontSize: 11,
	                labelString:'°C'
	              },
	          },
						{
							ticks: {
								min: 50,
								max: 60,
								stepSize: 2,
								fontColor: "rgba(128,128,128,0.4)",
								fontSize: 11,
								fontFamily: 'open-sans',
							},
								gridLines: {
									zeroLineWidth: 1,
									zeroLineColor: "rgba(128,128,128,0.4)",
								},
								scaleLabel: {
									fontColor: "rgba(128,128,128,0.4)",
									fontSize: 11,
									labelString:'%'
								},
						}],
	          xAxes: [{
	            ticks: {
	              fontColor: "rgba(128,128,128,0.4)",
	              fontSize: 10,
	              fontFamily: 'open-sans',
	            },
	            gridLines: {
	              display: false,
	            },
	          }]
	        }
	      },
      }
  }
}OK, and do you think that can be solved? Would it be possible in the future to add a popup graph to an arbitrary block? I would hate you to become boredclinkadink wrote: ↑Wednesday 26 February 2020 19:33 Yes, and that is why I changed it to 199 in my example that I provided