Multiple sources in one graph

Dashticz, alternative dashboard based on HTML, CSS, jQuery

Moderators: leecollings, htilburgs, robgeerts

Post Reply
User avatar
Sjonnie2017
Posts: 361
Joined: Wednesday 02 August 2017 19:43
Target OS: Linux
Domoticz version: Latest ß
Location: The Netherlands
Contact:

Re: Multiple sources in one graph

Post by Sjonnie2017 »

A lot of posts and a lot of answers to provide ;) This will lead to a number of posts by yours truly. I'll begin with this one:
dgrostoto wrote: Tuesday 11 February 2020 7:27 @Sjonnie2017
In your post, how do you refer to device idx ? (since there is no number in title graph nor device option)
https://www.domoticz.com/forum/posting. ... 7&p=236375
I have a section in my config.js where I define variables to be used instead of IDX numbers. It's easier on the eye and prevents confusion when editing. So for my energy meter I have defined the following variables:

Code: Select all

// Gas en elektra
var elektra                    = 199;
var gas                        = 200;
var elektra_nu                 = '199_1';
var elektra_vandaag            = '199_2';
var elektra_totaal             = '199_3';
var grafiek_gas                = 'graph_200';
var grafiek_elektra            = 'graph_199';
On the plus side: my editor (Geany) provides easy suggestions when I use these variables :mrgreen:
ConBee II - TRÅDFRI lights + switches, loads of ChingLing dimmers and switches, Heiman and Xiaomi sensors
SolarEdge SE4000H (with active modbus_tcp)
YouLess Energy meter
Shelly 2.5 in roller shutter mode
User avatar
Sjonnie2017
Posts: 361
Joined: Wednesday 02 August 2017 19:43
Target OS: Linux
Domoticz version: Latest ß
Location: The Netherlands
Contact:

Re: Multiple sources in one graph

Post by Sjonnie2017 »

clinkadink wrote: Monday 10 February 2020 20:29 Originally, there was "exclude", to remove keys from the returned data. This is yours at the moment ...

Code: Select all

exclude: [ 'hu', 'ba'],
But now this has been replaced, with the existing "graphTypes" param. This provides the opposite capability, it tells Dashticz what to display from the returned data. Try this ...

Code: Select all

graphTypes: ['te'],
I added the parameter last evening. So for the temperature graph the code now looks like this (please ignore the "rem"ed out lines):

Code: Select all

blocks['multigraph_144'] = {
	title: 'Temperatuur Binnen',
    devices: [ 144, 145, 152, 158],
    sortDevices: true,
//	datasetColors: ['red', 'yellow', 'blue', 'green', 'beige', 'aqua', 'blueviolet', 'chartreuse', 'pink', 'greenyellow', 'indigo', 'lightgreen', 'seashell'],
	datasetColors: ['red', 'yellow', 'blue', 'green', 'red', 'aqua', 'blueviolet', 'blue', 'pink', 'greenyellow', 'green', 'lightgreen', 'seashell'],
	drawOrderMonth: [ 'te1', 'te2', 'te3', 'te4'],
	spanGaps: true,
	graphTypes: [ 'te'],
	graph: 'line',
//	legend: true,
	legend: {
      'te1': '℃ K',	  
//	  'ta1': '℃ K(avg)',
//	  'tm1': '℃ K(min)',
      'te2': '℃ W',	  
//	  'ta2': '℃ W(avg)',
//	  'tm2': '℃ W(min)',
	  'te3': '℃ V',	  
//	  'ta3': '℃ V(avg)',
//	  'tm3': '℃ V(min)',	
	  'te4': '℃ S'	  
//	  'ta4': '℃ S(avg)',
//	  'tm4': '℃ S(min)',  
   }
}
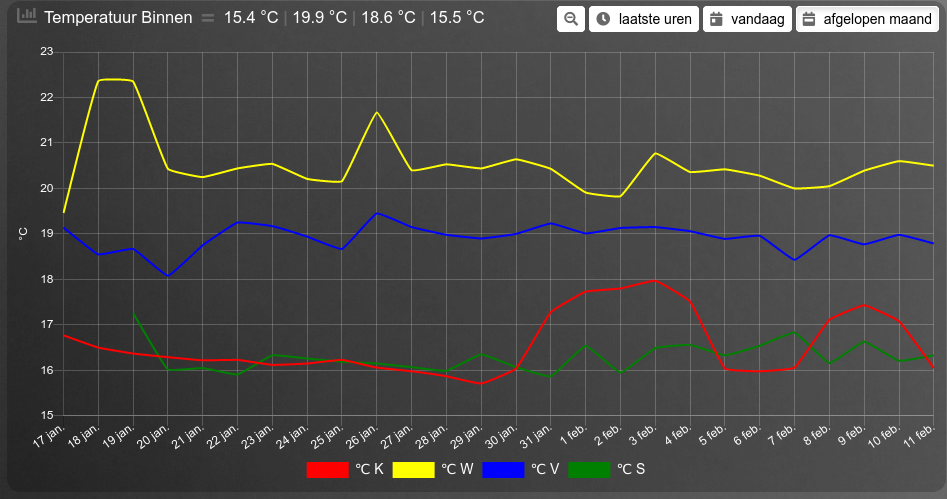
Which in turn leads to this graph (only showing month):

Image

Me like this graph ;)
Last edited by Sjonnie2017 on Tuesday 11 February 2020 18:53, edited 2 times in total.
ConBee II - TRÅDFRI lights + switches, loads of ChingLing dimmers and switches, Heiman and Xiaomi sensors
SolarEdge SE4000H (with active modbus_tcp)
YouLess Energy meter
Shelly 2.5 in roller shutter mode
User avatar
Sjonnie2017
Posts: 361
Joined: Wednesday 02 August 2017 19:43
Target OS: Linux
Domoticz version: Latest ß
Location: The Netherlands
Contact:

Re: Multiple sources in one graph

Post by Sjonnie2017 »

clinkadink wrote: Monday 10 February 2020 21:11
Sjonnie2017 wrote: Monday 10 February 2020 18:12 I love the legend on the Y-axis but am confused about all the (new) values.
Which bit? Seems clear to me ;)

I mentioned in the previous post, I need to know what device type and subtype are, and what the unit of measures are for c1, c2, c3 and c4. Once provided, I can get the code updated to recognise these keys, so they display the correct unit of measure. After that, you probably won't have 4 Y axes, as I am guessing that c2 and c4 are both the same unit of measure, and maybe even c1 and c3 too.

Image
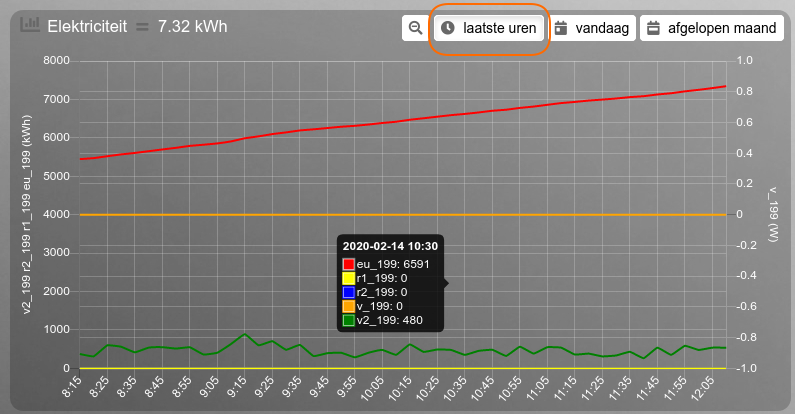
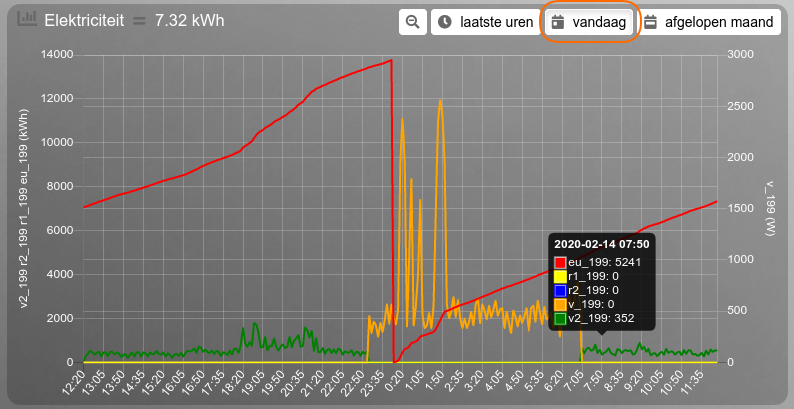
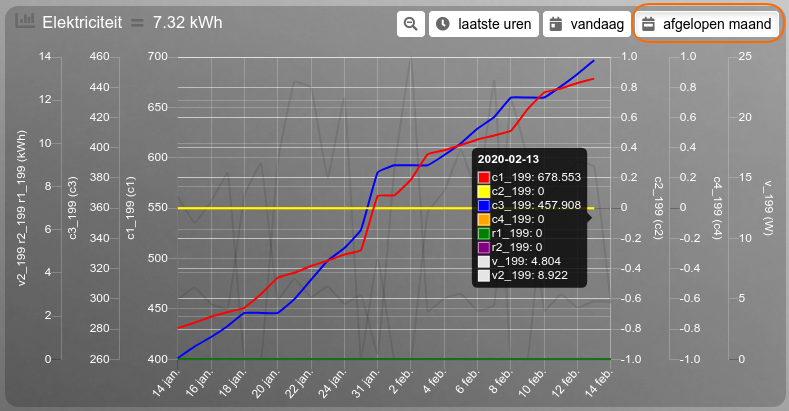
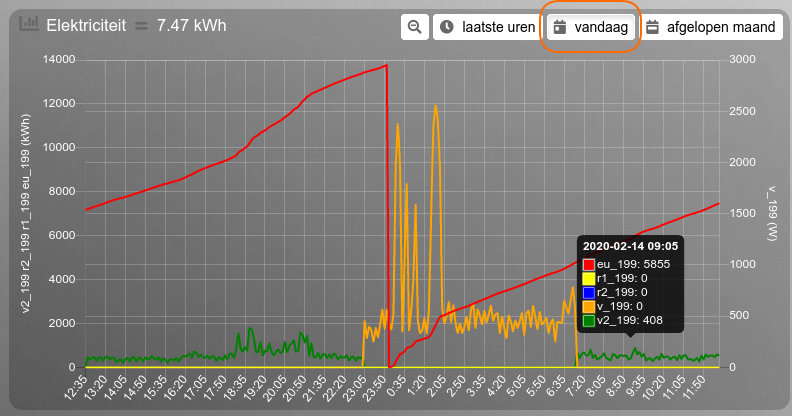
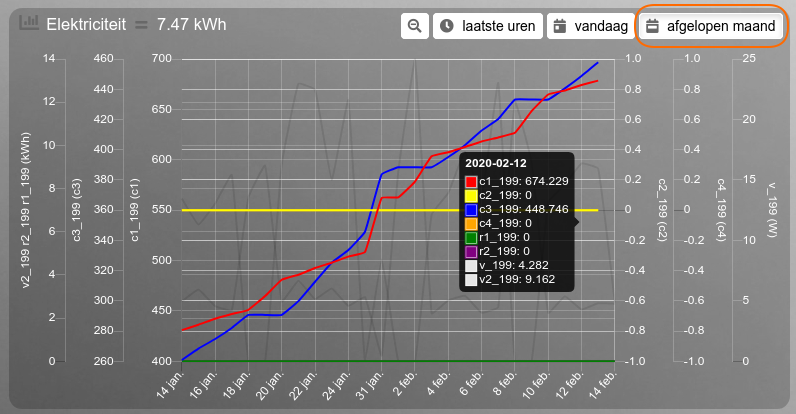
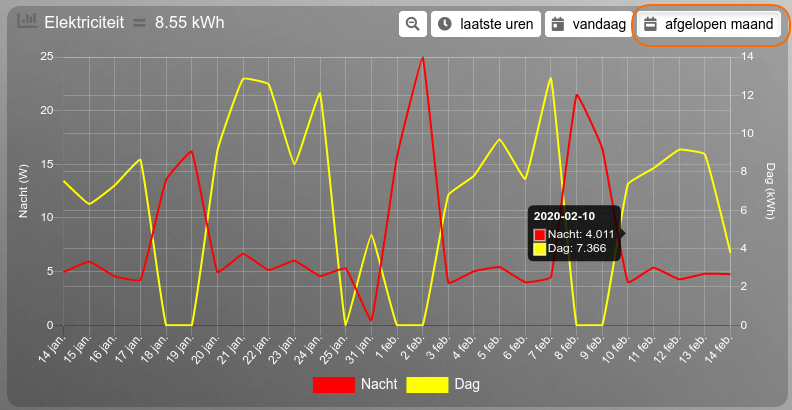
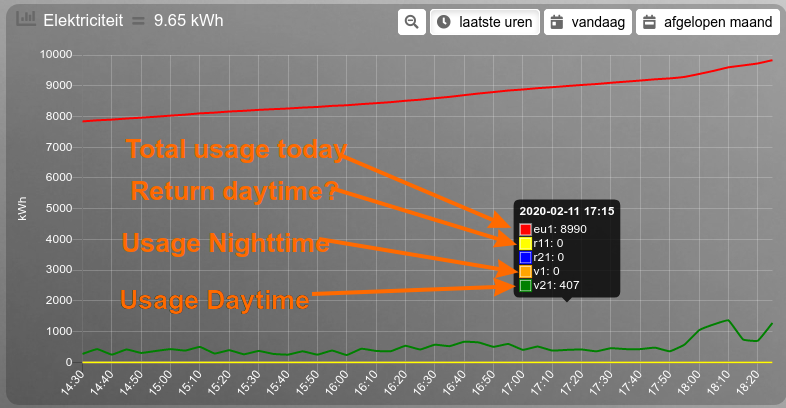
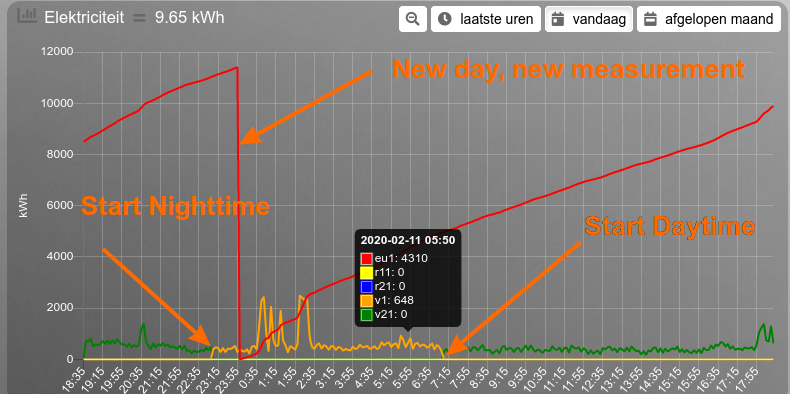
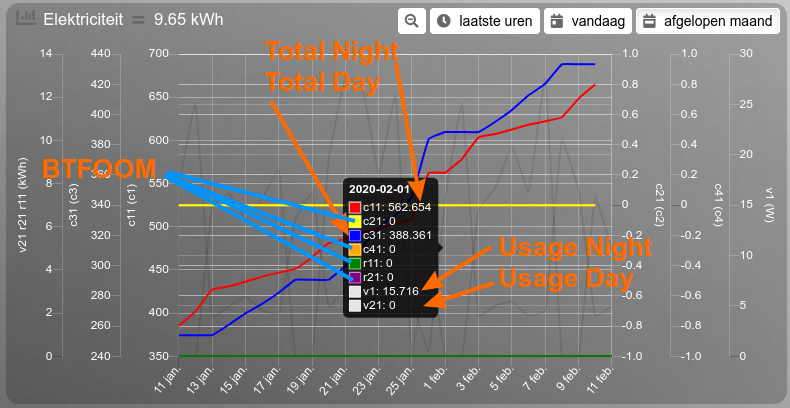
Well, I'll try to explain, The energy meter is a YouLess LS120. It registers the values for electricity and gas. Up until now It provided me with the following values: usage daytime, usage nighttime, return daytime and return nighttime (both always nil). It now looks like I have more readings than the meter should have. I have created a number of snapshots with what I think the readings should mean. But first the code:

Code: Select all

blocks[grafiek_elektra] = {}
blocks[grafiek_elektra]['title'] = 'Elektriciteit';
blocks[grafiek_elektra]['width'] = 12;
blocks[grafiek_elektra]['height'] = '400px';
//blocks[grafiek_elektra]['graph'] = 'bar';
blocks[grafiek_elektra]['legend'] = {'v': 'Nacht', 'v2': 'Dag'}
blocks[grafiek_elektra]['graphTypes'] = ['v', 'v2'];
blocks[grafiek_elektra]['pointFillColors'] = ['#aaa9a9', '#7e7e7e'];
blocks[grafiek_elektra]['pointSize'] = 3;
blocks[grafiek_elektra]['lineColors'] = ['#aaa9a9', '#7e7e7e'];
Last hours:
Image

Today:
Image

Last Month:
Image

I am not sure what you mean with device type and subtype so if above is not sufficient please clarify (English is not my native language;))

PS. BTFOOM Stands for Beats The F**ck Out Of Me :lol:
ConBee II - TRÅDFRI lights + switches, loads of ChingLing dimmers and switches, Heiman and Xiaomi sensors
SolarEdge SE4000H (with active modbus_tcp)
YouLess Energy meter
Shelly 2.5 in roller shutter mode
User avatar
Sjonnie2017
Posts: 361
Joined: Wednesday 02 August 2017 19:43
Target OS: Linux
Domoticz version: Latest ß
Location: The Netherlands
Contact:

Re: Multiple sources in one graph

Post by Sjonnie2017 »

Lokonli wrote: Monday 10 February 2020 23:08
Sjonnie2017 wrote: [EDIT]: Could the websocket thingy be the cause of the sensors showing up so late? So to get that to work I should upgrade to beta branch of Domoticz?
Which Domoticz version are you using?
Dashticz doesn't switch from a http connection to a websocket connection for older Domoticz versions.
There is no need to switch to the Domoticz beta branch unless you want to use the websocket connection.

Sent from my SM-A320FL using Tapatalk
I am using 4.10717. If the websocket thingy provides significant improvement on the appearance of the sensor blocks in my previous post I am more than willing to upgrade to beta ;)
ConBee II - TRÅDFRI lights + switches, loads of ChingLing dimmers and switches, Heiman and Xiaomi sensors
SolarEdge SE4000H (with active modbus_tcp)
YouLess Energy meter
Shelly 2.5 in roller shutter mode
dgrostoto
Posts: 7
Joined: Monday 10 February 2020 0:57
Target OS: Raspberry Pi / ODroid
Domoticz version:
Contact:

Re: Multiple sources in one graph

Post by dgrostoto »

OK, in fact you have only one device (youless LS120) providing all these values.
So, it is not a multigraph you're using (but i don't know if it matters after all since code seems to be merged).

AFAIK, the multigraph is used when the devices option in graph is used.

Concerning my testings, i use the device list in the graph blocks and i had several issues.
Here are some i figured out :
-the option concerning x max ticks does not seems to work at all (ie : i did not found any combination with several devices where this option seems to do something).
-when using custom data with defined time period : automatic update of the graph make appears more much time than i specified
-ordering temperature sensor before kwh sensor in the device list make some y axis disappear (just one y axis remaining)
-the "day" graph (second button), when there is no custom section show 7 days with 5min X ticks (too many data, graph is unreadable)
-sometimes there is a missing series (mainly at first load), i guess it is more a communication problem with domoticz, but OK on browser refresh (F5)

and maybe some problem with units when talking about kwh or watt, not sure i have to check this first.
User avatar
clinkadink
Posts: 417
Joined: Tuesday 31 December 2019 1:15
Target OS: Linux
Domoticz version: 2020.2
Location: Swindon, UK
Contact:

Re: Multiple sources in one graph

Post by clinkadink »

Sjonnie2017 wrote: Tuesday 11 February 2020 18:48 I am not sure what you mean with device type and subtype so if above is not sufficient please clarify
Each device has many properties provided by Domoticz. Two of them are "Type" and "SubType". You can query this with the following url.

Code: Select all

http://127.0.0.1:8080/json.htm?type=devices&rid=[idx]
Each key shown in your legend has an extra 1 appended to it. E.g. 'c2' becomes 'c21'. This is needed incase there are multiple devices with the same key. I need to know what is the unit of measure for each of those keys. The code can then be updated to show the correct unit of measure (e.g. kWh). By the way, I have seen 'c' keys before on devices. In my experience 'c' stands for cumulative.

As for the 'BTFOOM' keys ;), if these aren't required, use graphTypes to show only what is needed.
"UI is the saddle, the stirrups, & the reins. UX is the feeling you get being able to ride the horse."
User avatar
clinkadink
Posts: 417
Joined: Tuesday 31 December 2019 1:15
Target OS: Linux
Domoticz version: 2020.2
Location: Swindon, UK
Contact:

Re: Multiple sources in one graph

Post by clinkadink »

dgrostoto wrote: Tuesday 11 February 2020 23:44 OK, in fact you have only one device (youless LS120) providing all these values. So, it is not a multigraph you're using (but i don't know if it matters after all since code seems to be merged). AFAIK, the multigraph is used when the devices option in graph is used.
Single device graphs, multiple device graphs ... are treated the same now (as of latest beta). It makes no difference.
dgrostoto wrote: Tuesday 11 February 2020 23:44 -the option concerning x max ticks does not seems to work at all
Good catch. This previously worked, but has regressed in the latest update. I will fix. Thank you.
dgrostoto wrote: Tuesday 11 February 2020 23:44 when using custom data with defined time period : automatic update of the graph make appears more much time than i specified
This works fine on mine. Using 'last hours' in custom data, I specify 6 hours, my graph shows 6 hours. Likewise, when I specify 2 hours, my graph shows 2 hours.
Spoiler: show

Code: Select all

blocks['penthouse_cinema'] = {	
	title: 'Penthouse vs Cinema',
	devices: [10, 15],
	graphTypes: ['te'],
	custom : {
        "Last hours": {
            range: 'day',
            filter: '2 hours',
            data: {                
		te1: 'd.te1',
		te2: 'd.te2',
		delta: 'd.te2-d.te1'
            },
		},
        "Last week": {
            range: 'month',
            filter: '7 days',
            data: {
                te1: 'd.te1',
		te2: 'd.te2',
		delta: 'd.te2-d.te1'
            }
        },
        "Last 3 months": {
            range: 'year',
            filter: '3 months',
            data: {
                te1: 'd.te1',
		te2: 'd.te2',
		delta: 'd.te2-d.te1'
            }
        }
	},
	legend: true
} 
dgrostoto wrote: Tuesday 11 February 2020 23:44 the "day" graph (second button), when there is no custom section show 7 days with 5min X ticks (too many data, graph is unreadable)
This is standard behaviour. Once maxTickLimit is working, you will be able to specify the spacing yourself.
dgrostoto wrote: Tuesday 11 February 2020 23:44 sometimes there is a missing series (mainly at first load), i guess it is more a communication problem with domoticz, but OK on browser refresh (F5)
I cannot replicate this at my end. Are there any errors in devtools? Is it only on one graph? Is it multiple devices, if so, how many?
"UI is the saddle, the stirrups, & the reins. UX is the feeling you get being able to ride the horse."
User avatar
Sjonnie2017
Posts: 361
Joined: Wednesday 02 August 2017 19:43
Target OS: Linux
Domoticz version: Latest ß
Location: The Netherlands
Contact:

Re: Multiple sources in one graph

Post by Sjonnie2017 »

clinkadink wrote: Wednesday 12 February 2020 16:19 *snip*
Each device has many properties provided by Domoticz. Two of them are "Type" and "SubType". You can query this with the following url.

Code: Select all

http://127.0.0.1:8080/json.htm?type=devices&rid=[idx]
Each key shown in your legend has an extra 1 appended to it. E.g. 'c2' becomes 'c21'. This is needed incase there are multiple devices with the same key. I need to know what is the unit of measure for each of those keys. The code can then be updated to show the correct unit of measure (e.g. kWh). By the way, I have seen 'c' keys before on devices. In my experience 'c' stands for cumulative.

As for the 'BTFOOM' keys ;), if these aren't required, use graphTypes to show only what is needed.
Hmmm.... I pasted the URL in the browser address on the RPi3 and this is what I got:

Code: Select all

{
   "ActTime" : 1581529322,
   "AstrTwilightEnd" : "19:41",
   "AstrTwilightStart" : "06:08",
   "CivTwilightEnd" : "18:22",
   "CivTwilightStart" : "07:27",
   "DayLength" : "09:45",
   "NautTwilightEnd" : "19:02",
   "NautTwilightStart" : "06:47",
   "ServerTime" : "2020-02-12 18:42:02",
   "SunAtSouth" : "12:55",
   "Sunrise" : "08:02",
   "Sunset" : "17:47",
   "app_version" : "4.10717",
   "status" : "OK",
   "title" : "Devices"
}
Tried with the IDX numbers of the YouLess (I have 4 IDX numbers) but the result was more or less the same. Is the part after the json.htm the correct one?

EDIT: OK, I am a schmuck :lol: I needed to omit the square brackets ;)

Results of the four IDX types:

IDX 198:

Code: Select all

{
   "ActTime" : 1581529661,
   "AstrTwilightEnd" : "19:41",
   "AstrTwilightStart" : "06:08",
   "CivTwilightEnd" : "18:22",
   "CivTwilightStart" : "07:27",
   "DayLength" : "09:45",
   "NautTwilightEnd" : "19:02",
   "NautTwilightStart" : "06:47",
   "ServerTime" : "2020-02-12 18:47:41",
   "SunAtSouth" : "12:55",
   "Sunrise" : "08:02",
   "Sunset" : "17:47",
   "app_version" : "4.10717",
   "result" : [
      {
         "AddjMulti" : 1.0,
         "AddjMulti2" : 1.0,
         "AddjValue" : 0.0,
         "AddjValue2" : 0.0,
         "BatteryLevel" : 255,
         "Counter" : "945.775",
         "CounterToday" : "0",
         "CustomImage" : 0,
         "Data" : "945.775 kWh 536 Watt",
         "Description" : "",
         "Favorite" : 0,
         "HardwareID" : 17,
         "HardwareName" : "YouLess",
         "HardwareType" : "YouLess Meter with LAN interface",
         "HardwareTypeVal" : 6,
         "HaveTimeout" : true,
         "ID" : "80",
         "LastUpdate" : "2020-01-31 16:37:57",
         "Name" : "Unknown",
         "Notifications" : "false",
         "PlanID" : "0",
         "PlanIDs" : [ 0 ],
         "Protected" : false,
         "ShowNotifications" : true,
         "SignalLevel" : "-",
         "SubType" : "YouLess counter",
         "SwitchTypeVal" : 0,
         "Timers" : "false",
         "Type" : "YouLess Meter",
         "TypeImg" : "counter",
         "Unit" : 1,
         "Usage" : "536 Watt",
         "Used" : 1,
         "ValueQuantity" : "",
         "ValueUnits" : "",
         "XOffset" : "0",
         "YOffset" : "0",
         "idx" : "198"
      }
   ],
   "status" : "OK",
   "title" : "Devices"
}
IDX 199

Code: Select all

{
   "ActTime" : 1581529763,
   "AstrTwilightEnd" : "19:41",
   "AstrTwilightStart" : "06:08",
   "CivTwilightEnd" : "18:22",
   "CivTwilightStart" : "07:27",
   "DayLength" : "09:45",
   "NautTwilightEnd" : "19:02",
   "NautTwilightStart" : "06:47",
   "ServerTime" : "2020-02-12 18:49:23",
   "SunAtSouth" : "12:55",
   "Sunrise" : "08:02",
   "Sunset" : "17:47",
   "app_version" : "4.10717",
   "result" : [
      {
         "AddjMulti" : 1.0,
         "AddjMulti2" : 1.0,
         "AddjValue" : 0.0,
         "AddjValue2" : 0.0,
         "BatteryLevel" : 255,
         "Counter" : "1132.522",
         "CounterDeliv" : "0.000",
         "CounterDelivToday" : "0.000 kWh",
         "CounterToday" : "9.547 kWh",
         "CustomImage" : 0,
         "Data" : "678146;454376;0;0;598;0",
         "Description" : "",
         "Favorite" : 1,
         "HardwareID" : 17,
         "HardwareName" : "YouLess",
         "HardwareType" : "YouLess Meter with LAN interface",
         "HardwareTypeVal" : 6,
         "HaveTimeout" : false,
         "ID" : "0001",
         "LastUpdate" : "2020-02-12 18:49:22",
         "Name" : "Elektriciteit",
         "Notifications" : "false",
         "PlanID" : "0",
         "PlanIDs" : [ 0 ],
         "Protected" : false,
         "ShowNotifications" : true,
         "SignalLevel" : "-",
         "SubType" : "Energy",
         "SwitchTypeVal" : 0,
         "Timers" : "false",
         "Type" : "P1 Smart Meter",
         "TypeImg" : "counter",
         "Unit" : 1,
         "Usage" : "598 Watt",
         "UsageDeliv" : "0 Watt",
         "Used" : 1,
         "XOffset" : "0",
         "YOffset" : "0",
         "idx" : "199"
      }
   ],
   "status" : "OK",
   "title" : "Devices"
}
IDX 200:

Code: Select all

{
   "ActTime" : 1581529806,
   "AstrTwilightEnd" : "19:41",
   "AstrTwilightStart" : "06:08",
   "CivTwilightEnd" : "18:22",
   "CivTwilightStart" : "07:27",
   "DayLength" : "09:45",
   "NautTwilightEnd" : "19:02",
   "NautTwilightStart" : "06:47",
   "ServerTime" : "2020-02-12 18:50:06",
   "SunAtSouth" : "12:55",
   "Sunrise" : "08:02",
   "Sunset" : "17:47",
   "app_version" : "4.10717",
   "result" : [
      {
         "AddjMulti" : 1.0,
         "AddjMulti2" : 1.0,
         "AddjValue" : 0.0,
         "AddjValue2" : 0.0,
         "BatteryLevel" : 255,
         "Counter" : "368.785",
         "CounterToday" : "4.336 m3",
         "CustomImage" : 0,
         "Data" : "368.785",
         "Description" : "",
         "Favorite" : 1,
         "HardwareID" : 17,
         "HardwareName" : "YouLess",
         "HardwareType" : "YouLess Meter with LAN interface",
         "HardwareTypeVal" : 6,
         "HaveTimeout" : false,
         "ID" : "0001",
         "LastUpdate" : "2020-02-12 18:45:20",
         "Name" : "Gas",
         "Notifications" : "false",
         "PlanID" : "0",
         "PlanIDs" : [ 0 ],
         "Protected" : false,
         "ShowNotifications" : true,
         "SignalLevel" : "-",
         "SubType" : "Gas",
         "SwitchTypeVal" : 1,
         "Timers" : "false",
         "Type" : "P1 Smart Meter",
         "TypeImg" : "counter",
         "Unit" : 2,
         "Used" : 1,
         "XOffset" : "0",
         "YOffset" : "0",
         "idx" : "200"
      }
   ],
   "status" : "OK",
   "title" : "Devices"
}
IDX 201:

Code: Select all

{
   "ActTime" : 1581529845,
   "AstrTwilightEnd" : "19:41",
   "AstrTwilightStart" : "06:08",
   "CivTwilightEnd" : "18:22",
   "CivTwilightStart" : "07:27",
   "DayLength" : "09:45",
   "NautTwilightEnd" : "19:02",
   "NautTwilightStart" : "06:47",
   "ServerTime" : "2020-02-12 18:50:45",
   "SunAtSouth" : "12:55",
   "Sunrise" : "08:02",
   "Sunset" : "17:47",
   "app_version" : "4.10717",
   "result" : [
      {
         "AddjMulti" : 1.0,
         "AddjMulti2" : 1.0,
         "AddjValue" : 0.0,
         "AddjValue2" : 0.0,
         "BatteryLevel" : 255,
         "CounterToday" : "0.000 kWh",
         "CustomImage" : 0,
         "Data" : "0.000 kWh",
         "Description" : "",
         "EnergyMeterMode" : "",
         "Favorite" : 0,
         "HardwareID" : 17,
         "HardwareName" : "YouLess",
         "HardwareType" : "YouLess Meter with LAN interface",
         "HardwareTypeVal" : 6,
         "HaveTimeout" : false,
         "ID" : "00001101",
         "LastUpdate" : "2020-02-12 18:50:42",
         "Name" : "S0",
         "Notifications" : "false",
         "PlanID" : "0",
         "PlanIDs" : [ 0 ],
         "Protected" : false,
         "ShowNotifications" : true,
         "SignalLevel" : "-",
         "SubType" : "kWh",
         "SwitchTypeVal" : 0,
         "Timers" : "false",
         "Type" : "General",
         "TypeImg" : "current",
         "Unit" : 1,
         "Usage" : "0 Watt",
         "Used" : 0,
         "XOffset" : "0",
         "YOffset" : "0",
         "idx" : "201"
      }
   ],
   "status" : "OK",
   "title" : "Devices"
}
ConBee II - TRÅDFRI lights + switches, loads of ChingLing dimmers and switches, Heiman and Xiaomi sensors
SolarEdge SE4000H (with active modbus_tcp)
YouLess Energy meter
Shelly 2.5 in roller shutter mode
User avatar
clinkadink
Posts: 417
Joined: Tuesday 31 December 2019 1:15
Target OS: Linux
Domoticz version: 2020.2
Location: Swindon, UK
Contact:

Re: Multiple sources in one graph

Post by clinkadink »

Thanks Sjonnie, that's the detail I need. I will cross check this will the code later, and see what we can do.

Beta update:

In the meantime, the beta was updated last night incorporating several fixes. It also includes a change to the naming of the keys.

Before the code added a sequential number to each key, e.g. v1 becomes v11, c2 becomes c21.

Now, each device's key is appended with the device idx. E. g. v1 becomes v1_252, c2 becomes c2_279, etc.

This hopefully removes any confusion when trying to understand the relation between the keys and the devices. As a result of this change, you will need to update any legends containing keys. Hope that makes sense.

The block properties maxTicksLimit and reverseTime are also fixed in this latest update.

Cheers.

Sent from my HD1913 using Tapatalk

"UI is the saddle, the stirrups, & the reins. UX is the feeling you get being able to ride the horse."
User avatar
Sjonnie2017
Posts: 361
Joined: Wednesday 02 August 2017 19:43
Target OS: Linux
Domoticz version: Latest ß
Location: The Netherlands
Contact:

Re: Multiple sources in one graph

Post by Sjonnie2017 »

Hi,

Tx! I haven't had a notification for an update yet but will certainly install it and change the config.js according to your suggestion.

Thanks for your continued support!

Greetz,

Sjonnie

EDIT: A "git pull" did the trick. Unfortunately I still can't get the electricity graph to work :|

The code:

Code: Select all

blocks[grafiek_elektra] = {}
blocks[grafiek_elektra]['title'] = 'Elektriciteit';
blocks[grafiek_elektra]['width'] = 12;
blocks[grafiek_elektra]['height'] = '500px';
//blocks[grafiek_elektra]['graph'] = 'bar';
blocks[grafiek_elektra]['legend'] = {'v_199': 'Nacht', 'v2_199': 'Dag', 'eu_199': 'Totaal'}
//blocks[grafiek_elektra]['legend'] = true;
blocks[grafiek_elektra]['graphTypes'] = ['v_199', 'v2_199', 'eu_199'];
blocks[grafiek_elektra]['pointFillColors'] = ['#aaa9a9', '#7e7e7e'];
blocks[grafiek_elektra]['pointSize'] = 3;
blocks[grafiek_elektra]['lineColors'] = ['#aaa9a9', '#7e7e7e'];
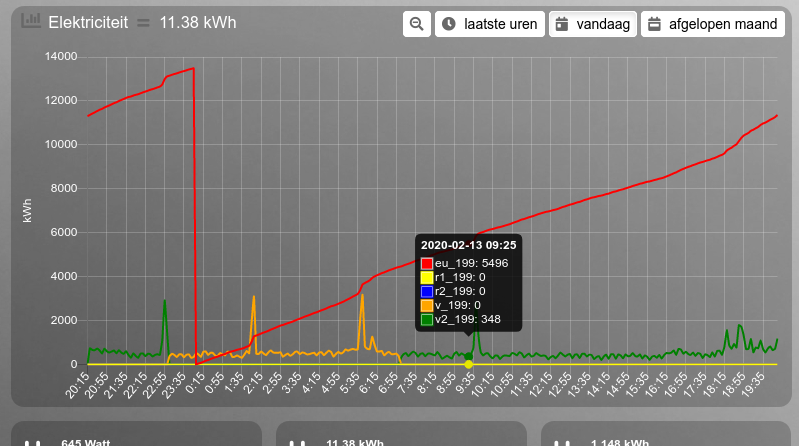
The resulting graph:

Image

I am probably missing something obvious here but can't figure out what. Note that adding "legend" = true doesn't change the appearance of the graph.
ConBee II - TRÅDFRI lights + switches, loads of ChingLing dimmers and switches, Heiman and Xiaomi sensors
SolarEdge SE4000H (with active modbus_tcp)
YouLess Energy meter
Shelly 2.5 in roller shutter mode
User avatar
clinkadink
Posts: 417
Joined: Tuesday 31 December 2019 1:15
Target OS: Linux
Domoticz version: 2020.2
Location: Swindon, UK
Contact:

Re: Multiple sources in one graph

Post by clinkadink »

Strange, I will try and replicate. I must admit, I can't get used to formatting the block like that ;)
"UI is the saddle, the stirrups, & the reins. UX is the feeling you get being able to ride the horse."
User avatar
clinkadink
Posts: 417
Joined: Tuesday 31 December 2019 1:15
Target OS: Linux
Domoticz version: 2020.2
Location: Swindon, UK
Contact:

Re: Multiple sources in one graph

Post by clinkadink »

I appreciate there has been quite a bit of change with the Dashticz graph over the past weeks. Properties have been added/removed, the single graph and multigraph were separate, but are now merged, etc. It still is still work in progress, there will be bugs, and I will try and be as responsive as possible in getting them fixed. So I really do value your patience and all your feedback ;)

I thought I'd take the opportunity to post an 'as-is' example, using the latest 3.3.4 beta.

In the example below, I am using color variables. If you try and copy/paste the code without these variables defined - it will error. I have added the color variables at the bottom of this post for anyone that wants them (solid and opaque colors).

This graph has 2 devices, my Solar inverter and my Energy Meter (measuring the Grid) on the left Y axis, i.e. electric generated vs consumed. I am also using custom data too, which adds another 2 datasets; Profit and Cost (on the right Y axis). The block below contains most (but not all) of the available parameters for a graph. Typically, you wouldn't need all of these. I am only trying to demonstrate the configuration using this beta.
Spoiler: show

Code: Select all

blocks['grid_solar'] = {
	barWidth: 0.7,
	borderDash: [],
	borderWidth: 2,
	buttonsBorder: sGreen,
	buttonsColor: sBlack,
	buttonsFill: sWhite,
	buttonsIcon: sGreen,
	buttonsMarginX: 2,
	buttonsMarginY: 2,
	buttonsPadX: 10,
	buttonsPadY: 5,
	buttonsRadius: 0,
	buttonsShadow: oBlueLight,
	buttonsSize: 12,
	buttonsText: ['Today', 'Week', 'Quarter'],
	cartesian: 'linear',
	custom : {
        "24 Hours": {
	    ylabels: ['W','W','£','£'],
            range: 'day',
	    filter: '24 hours',
            data: {
                Solar: 'd.v_1',
		Grid: 'd.v_258',
		Profit:'d.v_1*0.000151',
		Cost:'d.v_258*-0.000112'
            },
	},
        "Last week": {
	    ylabels: ['kWh','kWh','£','£'],
            range: 'month',
            filter: '7 days',
            data: {
                Solar: 'd.v_1',
		Grid: 'd.v_258',
		Profit:'d.v_1*0.151',
		Cost:'d.v_258*-0.112'
            }
        },
        "Last 3 months": {
	    ylabels: ['kWh','kWh','£','£'],
            range: 'year',
            filter: '3 months',
            data: {
                Solar: 'd.v_1',
		Grid: 'd.v_258',
		Profit:'d.v_1*0.151',
		Cost:'d.v_258*-0.112'
            }
        }
	},
	datasetColors: [oGreen, oRed, sYellow, sBlue],
	devices: [1, 258],
	graph: ['line','line','bar','bar'],	
	interval: 1,
	legend: true,
	lineFill: [true, true],
	lineTension: 0.4,
	maxTicksLimit: 20,
	pointRadius: 1,
	reverseTime: false,
	sortOrder: false,
	spanGaps: true,
	title: 'Grid vs Solar'
} 
Image

Solid Colors:
Spoiler: show

Code: Select all

var sLightGrey = 'rgba(141, 188, 181, 1)';
var sRed = 'rgba(217, 83, 79, 1)';
var sGreen = 'rgba(92, 184, 92, 1)';
var sGreenDark	= 'rgba(20, 90, 50, 1)';
var sBlue = 'rgba(2, 117, 216, 1)';
var sBlueLight = 'rgba(91, 192, 222, 1)';
var sOrange = 'rgba(240, 173, 78, 1)';
var sDarkGrey = 'rgba(41, 43, 44, 1)';
var sYellow = 'rgba(204, 244, 97, 1)';
var sPurple = 'rgba(108, 87, 145, 1)';
var sBrown = 'rgba(90, 70, 45, 1)';
var sPink = 'rgba(160, 83, 185, 1)';
var sAqua = 'rgba(35, 245, 224, 1)';
var sWhite = 'rgba(255, 255, 255, 1)';
var sGold = 'rgba(255, 215, 0, 1)';
var sBlack = 'rgba(0, 0, 0, 1)';
Opaque Colors:
Spoiler: show

Code: Select all

var oLightGrey = 'rgba(141, 188, 181, 0.7)';
var oRed = 'rgba(217, 83, 79, 0.4)';
var oGreen = 'rgba(92, 184, 92, 0.7)';
var oGreenDark	= 'rgba(20, 90, 50, 0.7)';
var oBlue = 'rgba(2, 117, 216, 0.7)';
var oBlueLight = 'rgba(91, 192, 222, 0.7)';
var oOrange = 'rgba(240, 173, 78, 0.7)';
var oDarkGrey = 'rgba(41, 43, 44, 0.7)';
var oYellow = 'rgba(204, 244, 97, 0.7)';
var oPurple = 'rgba(108, 87, 145, 0.7)';
var oBrown = 'rgba(90, 70, 45, 0.7)';
var oPink = 'rgba(160, 83, 185, 0.7)';
var oAqua = 'rgba(35, 245, 224, 0.7)';
var oWhite = 'rgba(255, 255, 255, 0.7)';
var oGold = 'rgba(255, 215, 0, 0.7)';
var oBlack = 'rgba(0, 0, 0, 0.7)';
Right, back to coding :)
"UI is the saddle, the stirrups, & the reins. UX is the feeling you get being able to ride the horse."
User avatar
clinkadink
Posts: 417
Joined: Tuesday 31 December 2019 1:15
Target OS: Linux
Domoticz version: 2020.2
Location: Swindon, UK
Contact:

Re: Multiple sources in one graph

Post by clinkadink »

Sjonnie2017 wrote: Thursday 13 February 2020 19:05

Code: Select all

blocks[grafiek_elektra] = {}
blocks[grafiek_elektra]['title'] = 'Elektriciteit';
blocks[grafiek_elektra]['width'] = 12;
blocks[grafiek_elektra]['height'] = '500px';
blocks[grafiek_elektra]['legend'] = {'v_199': 'Nacht', 'v2_199': 'Dag', 'eu_199': 'Totaal'}
blocks[grafiek_elektra]['graphTypes'] = ['v_199', 'v2_199', 'eu_199'];
blocks[grafiek_elektra]['pointFillColors'] = ['#aaa9a9', '#7e7e7e'];
blocks[grafiek_elektra]['pointSize'] = 3;
blocks[grafiek_elektra]['lineColors'] = ['#aaa9a9', '#7e7e7e'];
I am probably missing something obvious here but can't figure out what. Note that adding "legend" = true doesn't change the appearance of the graph.
I just noticed a few things wrong with your block.

Your graphTypes is incorrect. You should specify the original keys from your device(s), not the newly created keys. In other words, try this ...

Code: Select all

blocks[grafiek_elektra]['graphTypes'] = ['v', 'v2', 'eu'];
Also, you have pointSize defined. I do not recognise this. I think you mean pointRadius?

Code: Select all

blocks[grafiek_elektra]['pointRadius'] = 3;
Finally, I am not sure what lineColors is. Again, its not a parameter in the graph block. If you have a line graph, and you want to fill it with one color and have the lines a different color, you do it like this (e.g. with 4 datasets):

Code: Select all

lineFill: [true, true, true, true],
borderColors:['red', 'blue', 'green', 'orange'],
datasetColors: ['brown', 'white', 'pink', 'aqua'],
Try this and then post a screenshot of your graph. I need to see which key goes with which device. E.g. eu_199, etc.
"UI is the saddle, the stirrups, & the reins. UX is the feeling you get being able to ride the horse."
User avatar
Sjonnie2017
Posts: 361
Joined: Wednesday 02 August 2017 19:43
Target OS: Linux
Domoticz version: Latest ß
Location: The Netherlands
Contact:

Re: Multiple sources in one graph

Post by Sjonnie2017 »

Hi,

Appreciate all the time and effort you put in to this!

I have cleaned up and adjusted the code. The lineColor and pointSize are remnants of an early experiment. I have no need for them so I removed them completely.

The code:

Code: Select all

blocks[grafiek_elektra] = {}
blocks[grafiek_elektra]['title'] = 'Elektriciteit';
blocks[grafiek_elektra]['width'] = 12;
blocks[grafiek_elektra]['height'] = '500px';
blocks[grafiek_elektra]['legend'] = {'v': 'Nacht', 'v2': 'Dag', 'eu': 'Totaal'}
//blocks[grafiek_elektra]['legend'] = true;
blocks[grafiek_elektra]['graphTypes'] = ['v', 'v2', 'eu'];
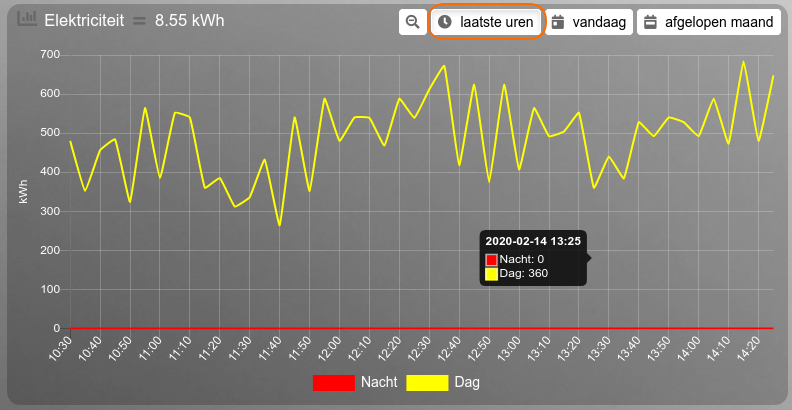
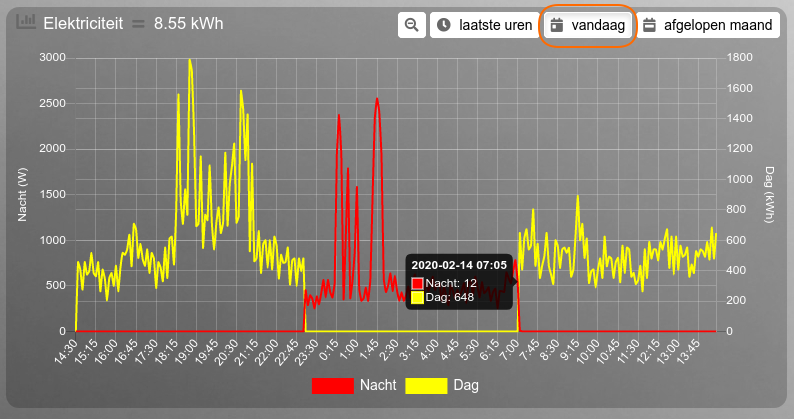
The graphs that it produces:

Image

Image

Image

And to avoid any confusion over the manner I use to describe my blocks, I thought I'd humor you and define the block in a more conventional way :)

The code:

Code: Select all

blocks['graph_199'] = {
	title: 'Electra',
	width: 12,
	height: '500px',
	graphTypes: [ 'v', 'v2',], // I left out the 'eu' to see if that makes a difference
	graph: 'line',
	legend: {
      'v': 'Nacht',
      'v2': 'Dag'
    }
}
The subsequent graphs:

Image

Image

Image

A few things I have noticed over the last couple of days after the major overhaul of the graphs section apart from the issues we're addressing:
  • I cannot get the legend for gas or electricty to show up whatever I do (note that the multi_graphs do have a legend)
  • The height parameter does not work
Hope this makes sense...

Greetz,

Sjonnie
ConBee II - TRÅDFRI lights + switches, loads of ChingLing dimmers and switches, Heiman and Xiaomi sensors
SolarEdge SE4000H (with active modbus_tcp)
YouLess Energy meter
Shelly 2.5 in roller shutter mode
User avatar
clinkadink
Posts: 417
Joined: Tuesday 31 December 2019 1:15
Target OS: Linux
Domoticz version: 2020.2
Location: Swindon, UK
Contact:

Re: Multiple sources in one graph

Post by clinkadink »

Sjonnie2017 wrote: Friday 14 February 2020 12:36 And to avoid any confusion over the manner I use to describe my blocks, I thought I'd humor you and define the block in a more conventional way :)
Thanks! Much better! :lol:

The Legend keys need to be your newly created keys.

Change this ...

Code: Select all

legend: {
      'v': 'Nacht',
      'v2': 'Dag'
}
To this ...

Code: Select all

legend: {
      'v_199': 'Nacht',
      'v2_199': 'Dag',
      'r1_199': '???',
      'r2_199': '???',
      'eu_199': '???'
}
Also, do you know what units c1 and c3 are measuring??

Just an observation - I would remove r1, r2, c2 and c4 as they seem to return nothing. You can use graphTypes to limit what is displayed ;)

The height issue was reported last night and is being investigated.
"UI is the saddle, the stirrups, & the reins. UX is the feeling you get being able to ride the horse."
User avatar
Sjonnie2017
Posts: 361
Joined: Wednesday 02 August 2017 19:43
Target OS: Linux
Domoticz version: Latest ß
Location: The Netherlands
Contact:

Re: Multiple sources in one graph

Post by Sjonnie2017 »

Hi,

Tried that but no difference I am afraid

Code: Select all

blocks['graph_199'] = {
	title: 'Electra',
	width: 12,
	height: '500px',
	graphTypes: [ 'v', 'v2'], // Also tried 'v_199' and 'v2_199' but no joy
	graph: 'line',
	legend: {
      'v_199': 'Nacht',
      'v2_199': 'Dag',
      'r1_199': 'Return1',
      'r2_199': 'Return2',
      'eu_199': 'Totaal'
		}
}
EDIT1: I think c1 is total usage daytime and c3 is total usage nighttime.
EDIT2: I was under the impression that I already limited the graph to display v and v2 ;)
ConBee II - TRÅDFRI lights + switches, loads of ChingLing dimmers and switches, Heiman and Xiaomi sensors
SolarEdge SE4000H (with active modbus_tcp)
YouLess Energy meter
Shelly 2.5 in roller shutter mode
User avatar
clinkadink
Posts: 417
Joined: Tuesday 31 December 2019 1:15
Target OS: Linux
Domoticz version: 2020.2
Location: Swindon, UK
Contact:

Re: Multiple sources in one graph

Post by clinkadink »

Sjonnie2017 wrote: Friday 14 February 2020 13:44 Tried that but no difference I am afraid
You have not set devices param - and therefore, Dashticz thinks its an undefined graph and will always apply the default block config. Just add ...

Code: Select all

devices: [199]
You can also change the block name, and update your column def.

Code: Select all

blocks['graph_199'] 
To

Code: Select all

blocks['elektriciteit'] 
Sjonnie2017 wrote: Friday 14 February 2020 13:44 I think c1 is total usage daytime and c3 is total usage nighttime.
OK, so it is c1 = kWh or c3 = m3? I recall you saying it is electric and gas?
Sjonnie2017 wrote: Friday 14 February 2020 13:44 I was under the impression that I already limited the graph to display v and v2 ;)
Adding devices param should solve this.
"UI is the saddle, the stirrups, & the reins. UX is the feeling you get being able to ride the horse."
User avatar
Sjonnie2017
Posts: 361
Joined: Wednesday 02 August 2017 19:43
Target OS: Linux
Domoticz version: Latest ß
Location: The Netherlands
Contact:

Re: Multiple sources in one graph

Post by Sjonnie2017 »

Progress! I like that :) I should have known I had to define the device parameter (I also did that with the multi sensors) but somehow that didn't land in my brain.

So this is the code at this moment:

Code: Select all

blocks[grafiek_elektra] = {
	devices: [199],
	title: 'Elektra',
	width: 12,
	height: '500px',
	graphTypes: [ 'v', 'v2'],
	graph: 'line',
//	drawOrderLast: [ 'v', 'v2'],
//	drawOrderDay: [ 'v', 'v2'],
//	drawOrderMonth: [ 'v', 'v2'],
	sortDevices: true,
	legend: {
      'v2_199': 'Dag',
      'v_199': 'Nacht',
		}
}
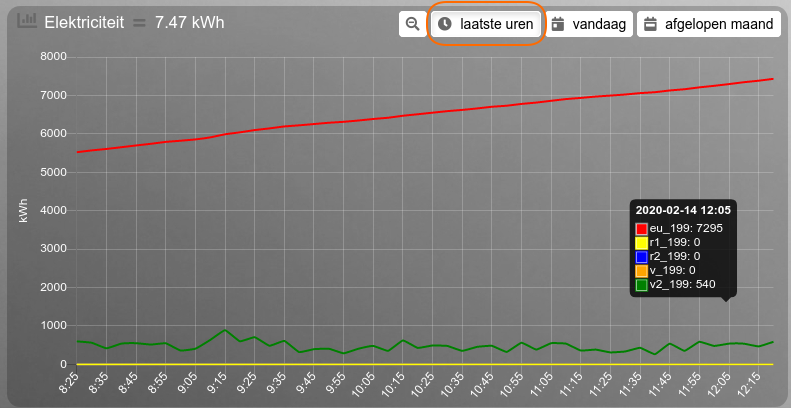
And (again :mrgreen: ) the resulting graphs:

Image

Image

Image


C1 and C3 I think are kWh. If I add C1 and C3 I get EU :)

If you will indulge some nitpicking: how can I change the order of the legend? I would like to have "Dag" before "Nacht". I have experimented with drawOrderLast/Day/Month and sortDevices and changed the entries for the legend (eg. v_199 before v2_199) but none of them changed the order of the legend.

EDIT: And of course changed the block back to the way I am used to :lol:

Code: Select all

blocks[grafiek_elektra] = {}
blocks[grafiek_elektra]['title'] = 'Elektriciteit';
blocks[grafiek_elektra]['devices'] = [199];
blocks[grafiek_elektra]['width'] = 12;
blocks[grafiek_elektra]['height'] = '500px';
blocks[grafiek_elektra]['graphTypes'] = ['v', 'v2'];
blocks[grafiek_elektra]['graph'] = 'line';
blocks[grafiek_elektra]['sortDevices'] = true;
blocks[grafiek_elektra]['legend'] = {'v_199': 'Nacht', 'v2_199': 'Dag'}
With the exact same result :)
ConBee II - TRÅDFRI lights + switches, loads of ChingLing dimmers and switches, Heiman and Xiaomi sensors
SolarEdge SE4000H (with active modbus_tcp)
YouLess Energy meter
Shelly 2.5 in roller shutter mode
User avatar
clinkadink
Posts: 417
Joined: Tuesday 31 December 2019 1:15
Target OS: Linux
Domoticz version: 2020.2
Location: Swindon, UK
Contact:

Re: Multiple sources in one graph

Post by clinkadink »

Great! Thanks for letting me know it now works.

The drawOrderLast/Day/Month is the order in which the datasets are drawn (rendered) on the canvas. Not for the legend. To be honest, I would like this too. I did try what you tried (device order, drawOrder and key order) but it makes no difference.

The reason why it is doing this is very simple. The legend is added alphabetically using the key. In your case, v1_199 comes before v2_199 ;)

I will try to solve this, once I fix the height issue. But no guarantees it can be done.
"UI is the saddle, the stirrups, & the reins. UX is the feeling you get being able to ride the horse."
User avatar
Sjonnie2017
Posts: 361
Joined: Wednesday 02 August 2017 19:43
Target OS: Linux
Domoticz version: Latest ß
Location: The Netherlands
Contact:

Re: Multiple sources in one graph

Post by Sjonnie2017 »

Hi,

The order of the legend is not a big issue. It's a "nice to have". I think focusing on the height issue is indeed more important.

I am not sure if you are now the "lead developer" of the graphs in Dashticz. But if so I would like to propose something for the "roadmap" if I may?

The thing is: the graph for Electricity is showing the total usage of the current day in the header where the graph for Gas shows me the total usage of all time in the header. Would be a "nice to have" (also) if this was configurable. See my numerous screenshots for examples :lol:

Greetz,

Sjonnie
ConBee II - TRÅDFRI lights + switches, loads of ChingLing dimmers and switches, Heiman and Xiaomi sensors
SolarEdge SE4000H (with active modbus_tcp)
YouLess Energy meter
Shelly 2.5 in roller shutter mode
Post Reply

Who is online

Users browsing this forum: No registered users and 0 guests