- Spoiler: show
Code: Select all
{
	"ActTime" : 1585559024,
	"AstrTwilightEnd" : "22:12",
	"AstrTwilightStart" : "05:20",
	"CivTwilightEnd" : "20:47",
	"CivTwilightStart" : "06:46",
	"DayLength" : "12:53",
	"NautTwilightEnd" : "21:28",
	"NautTwilightStart" : "06:04",
	"ServerTime" : "2020-03-30 11:03:44",
	"SunAtSouth" : "13:46",
	"Sunrise" : "07:20",
	"Sunset" : "20:13",
	"app_version" : "2020.1",
	"result" :
	[
		{
			"AddjMulti" : 1.0,
			"AddjMulti2" : 1.0,
			"AddjValue" : 0.0,
			"AddjValue2" : 0.0,
			"BatteryLevel" : 255,
			"Counter" : "14260.272",
			"CounterDeliv" : "3768.435",
			"CounterDelivToday" : "0.241 kWh",
			"CounterToday" : "3.470 kWh",
			"CustomImage" : 0,
			"Data" : "7129707;7130565;1139873;2628562;0;297",
			"Description" : "",
			"Favorite" : 1,
			"HardwareID" : 3,
			"HardwareName" : "Slimme Meter",
			"HardwareType" : "P1 Smart Meter USB",
			"HardwareTypeVal" : 4,
			"HaveTimeout" : false,
			"ID" : "0001",
			"LastUpdate" : "2020-03-30 11:03:42",
			"Name" : "Energie",
			"Notifications" : "false",
			"PlanID" : "2",
			"PlanIDs" :
			[
				2
			],
			"Protected" : false,
			"ShowNotifications" : true,
			"SignalLevel" : "-",
			"SubType" : "Energy",
			"SwitchTypeVal" : 0,
			"Timers" : "false",
			"Type" : "P1 Smart Meter",
			"TypeImg" : "counter",
			"Unit" : 1,
			"Usage" : "0 Watt",
			"UsageDeliv" : "297 Watt",
			"Used" : 1,
			"XOffset" : "0",
			"YOffset" : "0",
			"idx" : "2"
		}
	],
	"status" : "OK",
	"title" : "Devices"
}
Dashticz Graphs - Features, Fixes & Updates
Moderators: leecollings, htilburgs, robgeerts
-
Boattailman
- Posts: 14
- Joined: Thursday 05 March 2020 23:04
- Target OS: Raspberry Pi / ODroid
- Domoticz version: 2020.2
- Contact:
Re: Dashticz Graphs - New Features, Fixes & Updates
- Spoiler: show
-
clinkadink

- Posts: 417
- Joined: Tuesday 31 December 2019 1:15
- Target OS: Linux
- Domoticz version: 2020.2
- Location: Swindon, UK
- Contact:
Re: Dashticz Graphs - New Features, Fixes & Updates
Sorry, that's the Domoticz device data. I meant the debug JSON from the graph. See here.
https://www.domoticz.com/forum/viewtopi ... 60#p237106
https://www.domoticz.com/forum/viewtopi ... 60#p237106
"UI is the saddle, the stirrups, & the reins. UX is the feeling you get being able to ride the horse."
-
Boattailman
- Posts: 14
- Joined: Thursday 05 March 2020 23:04
- Target OS: Raspberry Pi / ODroid
- Domoticz version: 2020.2
- Contact:
Re: Dashticz Graphs - New Features, Fixes & Updates
Sorry, next try:
- Spoiler: show
-
clinkadink
- Posts: 417
- Joined: Tuesday 31 December 2019 1:15
- Target OS: Linux
- Domoticz version: 2020.2
- Location: Swindon, UK
- Contact:
Re: Dashticz Graphs - New Features, Fixes & Updates
Thanks. I notice you have:
Code: Select all
graph: ["bar", "bar"]Code: Select all
"24 uur": {
  "range": "day",
  "filter": "24 hours",
  "data": {
    "Verbruik": "d.v_2+d.v2_2",
    "Opbrengst": "-d.r1_2-d.r2_2"
  },
  "graph": ["bar", "bar"]  <---- should not be here
},
"UI is the saddle, the stirrups, & the reins. UX is the feeling you get being able to ride the horse."
-
Boattailman
- Posts: 14
- Joined: Thursday 05 March 2020 23:04
- Target OS: Raspberry Pi / ODroid
- Domoticz version: 2020.2
- Contact:
Re: Dashticz Graphs - New Features, Fixes & Updates
Done, the double bar was a result of some testing, but after the removal its still not working
-
houtumj
- Posts: 3
- Joined: Saturday 28 July 2018 10:21
- Target OS: Raspberry Pi / ODroid
- Domoticz version:
- Contact:
Dashticz Graphs - New Features, Fixes & Updates
How can I change the popup graph from line to bar 3.4.1
I tried:
blocks['graph_2447'] = {
devices: [2447],
title: 'Zonnestroom',
graph: ["bar"],
datasetColors: ['yellow'],
legend: {
'v': 'Zonnestroom',
}
}
Please help.
What am I doing wrong?
I tried:
blocks['graph_2447'] = {
devices: [2447],
title: 'Zonnestroom',
graph: ["bar"],
datasetColors: ['yellow'],
legend: {
'v': 'Zonnestroom',
}
}
Please help.
What am I doing wrong?
-
clinkadink
- Posts: 417
- Joined: Tuesday 31 December 2019 1:15
- Target OS: Linux
- Domoticz version: 2020.2
- Location: Swindon, UK
- Contact:
Re: Dashticz Graphs - New Features, Fixes & Updates
Please see corrected block config below.houtumj wrote: Monday 30 March 2020 13:44 How can I change the popup graph from line to bar 3.4.1
I tried:
blocks['graph_2447'] = {
devices: [2447],
title: 'Zonnestroom',
graph: ["bar"],
datasetColors: ['yellow'],
legend: {
'v': 'Zonnestroom',
}
}
Please help.
What am I doing wrong?
Code: Select all
blocks["zonnestroom_graph"] = {
  devices: [2447],
  title: "Zonnestroom",
  graph: "bar",
  datasetColors: "yellow",
  legend: {
     "v_2447": "Zonnestroom"
  }
};"UI is the saddle, the stirrups, & the reins. UX is the feeling you get being able to ride the horse."
-
houtumj
- Posts: 3
- Joined: Saturday 28 July 2018 10:21
- Target OS: Raspberry Pi / ODroid
- Domoticz version:
- Contact:
Re: Dashticz Graphs - New Features, Fixes & Updates
Dear clinkadink,
I did a copy and paste, But no bar only a line graph.
So I think it has to be something else
Thanks anyway.
I did a copy and paste, But no bar only a line graph.
So I think it has to be something else
Thanks anyway.
-
clinkadink
- Posts: 417
- Joined: Tuesday 31 December 2019 1:15
- Target OS: Linux
- Domoticz version: 2020.2
- Location: Swindon, UK
- Contact:
Re: Dashticz Graphs - New Features, Fixes & Updates
Hmmm, odd. Try adding this to your graph's block config ...houtumj wrote: Monday 30 March 2020 14:23 Dear clinkadink,
I did a copy and paste, But no bar only a line graph.
So I think it has to be something else
Thanks anyway.
Code: Select all
graphTypes: ['v'],"UI is the saddle, the stirrups, & the reins. UX is the feeling you get being able to ride the horse."
-
clinkadink
- Posts: 417
- Joined: Tuesday 31 December 2019 1:15
- Target OS: Linux
- Domoticz version: 2020.2
- Location: Swindon, UK
- Contact:
Re: Dashticz Graphs - New Features, Fixes & Updates
OK, found the issue and will be submitting a fix shortly.Boattailman wrote: Monday 30 March 2020 13:07 Done, the double bar was a result of some testing, but after the removal its still not working
"UI is the saddle, the stirrups, & the reins. UX is the feeling you get being able to ride the horse."
-
Boattailman
- Posts: 14
- Joined: Thursday 05 March 2020 23:04
- Target OS: Raspberry Pi / ODroid
- Domoticz version: 2020.2
- Contact:
Re: Dashticz Graphs - New Features, Fixes & Updates
Thx for the effort so far!clinkadink wrote: Monday 30 March 2020 14:31OK, found the issue and will be submitting a fix shortly.Boattailman wrote: Monday 30 March 2020 13:07 Done, the double bar was a result of some testing, but after the removal its still not working
-
clinkadink
- Posts: 417
- Joined: Tuesday 31 December 2019 1:15
- Target OS: Linux
- Domoticz version: 2020.2
- Location: Swindon, UK
- Contact:
Re: Dashticz Graphs - New Features, Fixes & Updates
The stacked issue has now been resolved in the latest beta update, 3.4.1. Please apply and let me know if this has worked. ThanksBoattailman wrote: Monday 30 March 2020 15:30Thx for the effort so far!clinkadink wrote: Monday 30 March 2020 14:31OK, found the issue and will be submitting a fix shortly.Boattailman wrote: Monday 30 March 2020 13:07 Done, the double bar was a result of some testing, but after the removal its still not working
"UI is the saddle, the stirrups, & the reins. UX is the feeling you get being able to ride the horse."
-
Boattailman
- Posts: 14
- Joined: Thursday 05 March 2020 23:04
- Target OS: Raspberry Pi / ODroid
- Domoticz version: 2020.2
- Contact:
-
clinkadink
- Posts: 417
- Joined: Tuesday 31 December 2019 1:15
- Target OS: Linux
- Domoticz version: 2020.2
- Location: Swindon, UK
- Contact:
Re: Dashticz Graphs - New Features, Fixes & Updates
Cheers!
"UI is the saddle, the stirrups, & the reins. UX is the feeling you get being able to ride the horse."

-
clinkadink
- Posts: 417
- Joined: Tuesday 31 December 2019 1:15
- Target OS: Linux
- Domoticz version: 2020.2
- Location: Swindon, UK
- Contact:
Re: Dashticz Graphs - New Features, Fixes & Updates
Great news, glad you like it 
I have just now updated the latest beta's tooltip for any graph that is "stacked". It will now automatically display a "Total" figure in the tooltip, i.e. the sum of all stacked values.

I have just now updated the latest beta's tooltip for any graph that is "stacked". It will now automatically display a "Total" figure in the tooltip, i.e. the sum of all stacked values.
"UI is the saddle, the stirrups, & the reins. UX is the feeling you get being able to ride the horse."
-
clinkadink
- Posts: 417
- Joined: Tuesday 31 December 2019 1:15
- Target OS: Linux
- Domoticz version: 2020.2
- Location: Swindon, UK
- Contact:
Re: Dashticz Graphs - New Features, Fixes & Updates
The latest beta (today) includes some updates to graphs.

We can now update the block with the customHeader object as shown below:
The object accepts key value pairs. Standard Javascript or Jquery code can be used, where 'data' is the data you want to change.

- Graph header current values are now updated as soon as new data is received
- The graph block now accepts the 'flash' property, which will make the graph header data flash when new data is received (like with blocks)
- There is a new graph block property (object) that allows users to customise their graph header values, called customHeader.
We can now update the block with the customHeader object as shown below:
Code: Select all
blocks['bathroom_wetroom'] = {
    title: 'Bathroom vs Wetroom',
    devices: [12, 13],
    customHeader: {
        12: 'data.split(",").slice(0,2)',                     <---- update/format the data for idx 12
        13: 'data.split(",").slice(0,2)',                     <---- update/format the data for idx 13
        x:  '(data.12-data.13).toFixed(2) + " C"',            <---- append custom data based on idx 12 and idx 13
    },
    toolTipStyle: true,
    graph: "line",
    legend: true
}- To format/update the data being displayed by a device, use the idx (number) as the key.
- To add a new 'custom value' that is a calculation of existing device data, use any letter as the key.
"UI is the saddle, the stirrups, & the reins. UX is the feeling you get being able to ride the horse."
-
Minglarn

- Posts: 214
- Joined: Friday 21 August 2015 19:27
- Target OS: Raspberry Pi / ODroid
- Domoticz version: v3.8153
- Location: Stockholm / Sweden
- Contact:
Re: Dashticz Graphs - New Features, Fixes & Updates
Great work with graphs...
Can put away my PHP generated scripts now....
However, there is one thing that bother me...
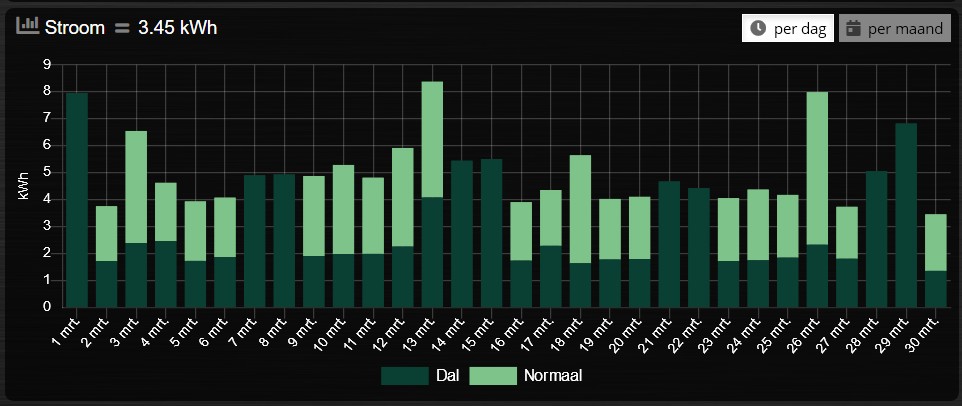
When choosing "month" view, it says "Njuk" instead of Mars .. What am I missing?
Using SE in config..
Can put away my PHP generated scripts now....
However, there is one thing that bother me...
When choosing "month" view, it says "Njuk" instead of Mars .. What am I missing?
Using SE in config..
Code: Select all
config['language'] = 'sv_SE'; //or: en_US, de_DE, fr_FR, hu_HU, it_IT, pt_PT, sv_SE- Attachments
-
- iframe6.JPG (44.51 KiB) Viewed 1980 times
“When you eliminate the impossible, whatever remains, however improbable, must be the truth.” -Spock in Star Trek VI
-
clinkadink
- Posts: 417
- Joined: Tuesday 31 December 2019 1:15
- Target OS: Linux
- Domoticz version: 2020.2
- Location: Swindon, UK
- Contact:
Re: Dashticz Graphs - New Features, Fixes & Updates
Thanks, its still work in progress, so I am very grateful for any feedback to help make it better 
I have just looked at the graph code, please can you try adding this to your config.js?
I am not sure why it is using the 'calendar language', and not the 'language'. I can correct that, but for now, if you can test the above line, that would be great.
I have just looked at the graph code, please can you try adding this to your config.js?
Code: Select all
config["calendarlanguage"] = 'sv_SE';"UI is the saddle, the stirrups, & the reins. UX is the feeling you get being able to ride the horse."
-
Minglarn
- Posts: 214
- Joined: Friday 21 August 2015 19:27
- Target OS: Raspberry Pi / ODroid
- Domoticz version: v3.8153
- Location: Stockholm / Sweden
- Contact:
Re: Dashticz Graphs - New Features, Fixes & Updates
Unfortunately its the same..
No change, did try Chrome in incognito mode and it's same...
No change, did try Chrome in incognito mode and it's same...
“When you eliminate the impossible, whatever remains, however improbable, must be the truth.” -Spock in Star Trek VI
Who is online
Users browsing this forum: No registered users and 1 guest