Page 1 of 1
Utilities and temperatures bar indicators
Posted: Sunday 10 September 2023 13:00
by psubiaco
Hi,
I love the Home Assistant gauge meters that shows the current power, temperature, humidity with a nice widget.
But I also love how the Domoticz reliability, even when several hundreds of devices are connected to it.
I believe that it will be nice to configure some devices in Domoticz to enable a bar widget, specifying:
* min value
* max value
* 2 or more ranges with associated color (usually green, yellow, red)
I've taken a snapshot and drawn some types of bar indicators, just to explain.
What do you think about? I know that it's easy to explain an idea, it's much much more difficult to implement it.
Thanks a lot.
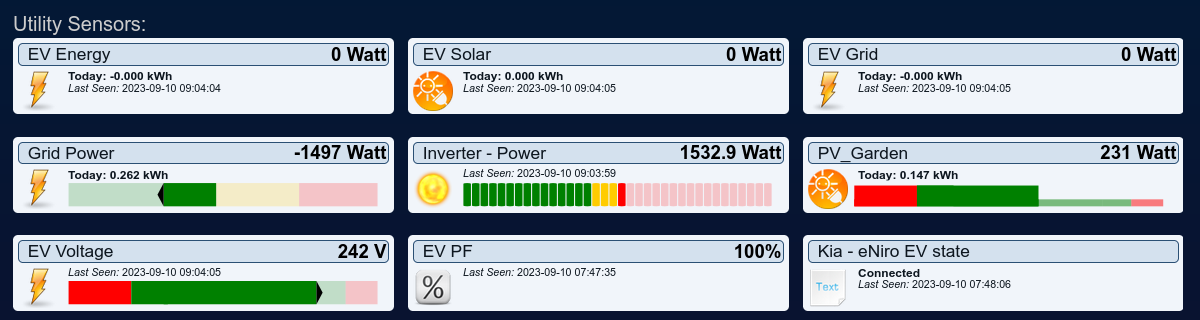
- domoticz_meters.png (73.16 KiB) Viewed 4953 times
Re: Utilities and temperatures bar indicators
Posted: Sunday 10 September 2023 13:34
by rron
I like the idea because you have a better overview and it looks fancy.
Re: Utilities and temperatures bar indicators
Posted: Sunday 10 September 2023 23:00
by waltervl
Domoticz already uses the high charts javascripts for creating the graphs, they also do something like you suggested eg
https://www.highcharts.com/demo/highcharts/bullet-graph
Re: Utilities and temperatures bar indicators
Posted: Monday 11 September 2023 7:55
by Doudy
Hello,
Yes, but how to integrate this into Domoticz?

Re: Utilities and temperatures bar indicators
Posted: Monday 11 September 2023 8:54
by waltervl
you have to know javascript and modify the appropiate javascript files in the domoticz www folder.
It perhaps also will need a database change as you have to remember the configuration per device and put those in the database.
Re: Utilities and temperatures bar indicators
Posted: Monday 11 September 2023 9:34
by Doudy
wow this is way too complicated for me...

Re: Utilities and temperatures bar indicators
Posted: Tuesday 12 September 2023 13:31
by RonkA
I made a crude form of bar indicator, No fancy colors, just text-based:
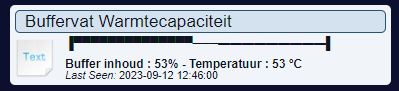
- Buffervat_Warmtecapaciteit.JPG (17.92 KiB) Viewed 4742 times
I made this to let people see the capacity of heat that is potentialy in the storagebuffer of my house.(if i would show them te actual numbers they have no clue..

)
The thin line is to display between 24 and 59 degrees, then the thicker line is to display 60 to 75 degrees.
(the value being the same at '53' is just a coincidence...)
It functions ok, only when the value changes the text-device is updated to minimize filling the log with old texts.
Once in a while i have to manualy clear the log because this is not possible to automatically by Domoticz..
Log is now cleared automatically.
Re: Utilities and temperatures bar indicators
Posted: Tuesday 12 September 2023 17:44
by psubiaco
RonkA wrote: Tuesday 12 September 2023 13:31
I made a crude form of bar indicator, No fancy colors, just text-based:
Your is a niceand tricky workaround, but the idea is to have, in your case, a normal temperature device within the bar: in this case if you click on the device you can see the chart with values of the last day, week, month, years.
Re: Utilities and temperatures bar indicators
Posted: Tuesday 12 September 2023 19:25
by waltervl
psubiaco wrote: Tuesday 12 September 2023 17:44
RonkA wrote: Tuesday 12 September 2023 13:31
I made a crude form of bar indicator, No fancy colors, just text-based:
Your is a niceand tricky workaround, but the idea is to have, in your case, a normal temperature device within the bar: in this case if you click on the device you can see the chart with values of the last day, week, month, years.
You know that temperature icons already change color based on the temperature, blue for very cold, green for cold, yellow for warm, red for hot...
Re: Utilities and temperatures bar indicators
Posted: Tuesday 12 September 2023 23:25
by RonkA
waltervl wrote: Tuesday 12 September 2023 19:25
You know that temperature icons already change color based on the temperature, blue for very cold, green for cold, yellow for warm, red for hot...
You Sir are correct!
The thing is that the colors are fixed to preset temperatures, for example:
The buffer i use is stone cold at 24 degrees;
I cannot extract any useful temperature out of it, at this temperature the icon is yellow but should be blue(or green) to be correct for this instance..
This would be nice to possible have this adjusted but it will not be done soon looking at:
https://github.com/domoticz/domoticz/issues/5718
psubiaco wrote: Tuesday 12 September 2023 17:44
Your is a nice and tricky workaround, but the idea is to have, in your case, a normal temperature device within the bar: in this case if you click on the device you can see the chart with values of the last day, week, month, years.
Oh i can see all these values in the device which is used for te data to make the text:
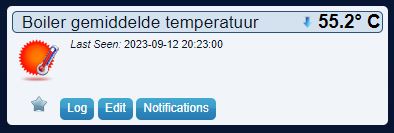
- Buffervat_Warmtecapaciteit1.JPG (18.34 KiB) Viewed 4693 times
What you are suggesting would be much easier and a hole lot prettier on the eyes and would be greatly appreciated but alas it is not 'yet' possible to have this in Domoticz. Maybe in the future?

I like the "Inverter - Power" one the most...

pretty nice.. (one of the parameters should contain the number of segments, 36 in your example, 27 in mine..)
Re: Utilities and temperatures bar indicators
Posted: Wednesday 13 September 2023 1:16
by waltervl
For what is worth I use the homehabit app on my Android tablet to control and show values. It is tile based and shows values in as gauges.
https://www.domoticz.com/wiki/Android#HomeHabit
Also available on IOS. But you need a tablet.
Re: Utilities and temperatures bar indicators
Posted: Wednesday 20 September 2023 8:27
by psubiaco
Now that setpoint device has changed in a very useful and general purpose way (
viewtopic.php?f=31&t=36200 ), I believe that a bar indicator will be very useful to display the setpoint status.
For example, if I have a device showing the target battery level for my car with range 20-100%, if the setpoint now is 60% I'd like to see a bar indicator half-filled. I think that Domoticz UI will be improved a lot with bar indicators.
Re: Utilities and temperatures bar indicators
Posted: Tuesday 23 April 2024 12:19
by psubiaco
I opened an issue on Domoticz github with the linear bar widget feature request, hoping that someone can develop that feature to get a nicer Domoticz panel.
https://github.com/domoticz/domoticz/issues/6060
Unfortunally I'm not familiar with JavaScript and UI, so I can't help, but I've contributed with some python plugins from Domoticz
https://github.com/CreasolTech?tab=repositories
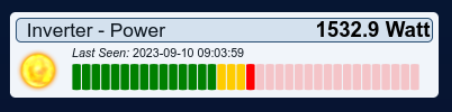
- Istantanea_2024-04-23_12-16-27.png (19.73 KiB) Viewed 3836 times
Re: Utilities and temperatures bar indicators
Posted: Tuesday 23 April 2024 20:35
by rron
I like the idea but I’ m afraid that i don’t have the qualifications to help you. The bars will give a nicer view.