Page 1 of 1
How to mimic Domoticz "past gas" graph?
Posted: Saturday 29 May 2021 7:43
by Multikoe
Domoticz has this feature in "Last Month" and "Last year" graphs that shows the values from the same month last year. I like this in my gas and electricity graphs that I get from my P1 smart meter as it allows me to compare my usage with last year's.
I have not found a way to mimic this in any Dasthicz graph. I have added a screenshot that shows what it looks like.
Any help or pointers would be welcome!
Re: How to mimic Domoticz "past gas" graph?
Posted: Saturday 29 May 2021 10:08
by HansieNL
As far as I know this is not possible. You can only retrieve info for max one year.
For example if you want to show may 2020 it can only show the days left this month and not the full month.
Re: How to mimic Domoticz "past gas" graph?
Posted: Saturday 29 May 2021 11:47
by waaren
HansieNL wrote: ↑Saturday 29 May 2021 10:08
As far as I know this is not possible. You can only retrieve info for max one year.
For example if you want to show may 2020 it can only show the days left this month and not the full month.
I don't know how the data is processed in Dashticz but to retrieve data from previous years / months from domoticz database.
Code: Select all
http://<domoticz ip: domoticz:port>/json.htm?actyear=<yyyy>&idx=<idx>&range=year&sensor=counter&type=graph
Re: How to mimic Domoticz "past gas" graph?
Posted: Saturday 29 May 2021 12:41
by HansieNL
waaren wrote: ↑Saturday 29 May 2021 11:47
HansieNL wrote: ↑Saturday 29 May 2021 10:08
As far as I know this is not possible. You can only retrieve info for max one year.
For example if you want to show may 2020 it can only show the days left this month and not the full month.
I don't know how the data is processed in Dashticz but to retrieve data from previous years / months from domoticz database.
Code: Select all
http://<domoticz ip: domoticz:port>/json.htm?actyear=<yyyy>&idx=<idx>&range=year&sensor=counter&type=graph
It's not a Domoticz limitation, but a Dashticz limitation.
range: This is the name of the range as requested from Domoticz, and can be 'day', 'today', 'month' or 'year'.
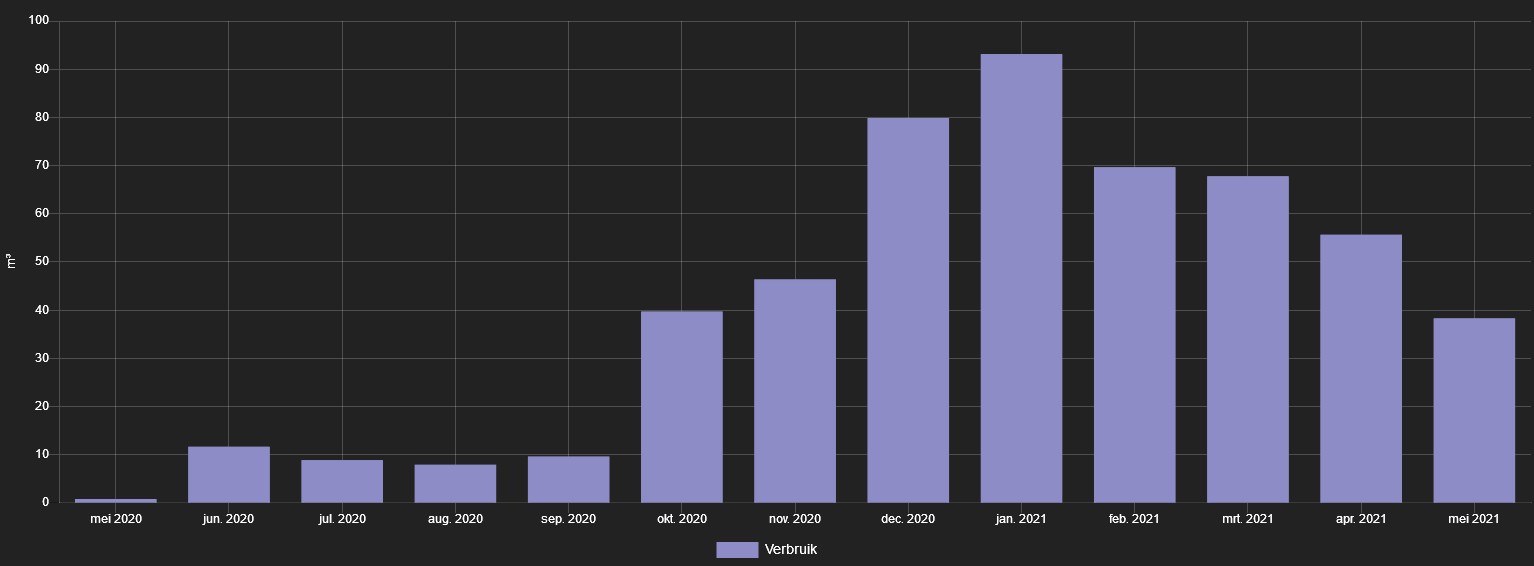
- Naamloos 1.jpg (71.28 KiB) Viewed 440 times
Now it looks like I almost didn't use gas in May 2020, but the value is just from today date till the end of the month.
Re: How to mimic Domoticz "past gas" graph?
Posted: Monday 31 May 2021 6:23
by Multikoe
HansieNL wrote: ↑Saturday 29 May 2021 12:41
waaren wrote: ↑Saturday 29 May 2021 11:47
HansieNL wrote: ↑Saturday 29 May 2021 10:08
As far as I know this is not possible. You can only retrieve info for max one year.
For example if you want to show may 2020 it can only show the days left this month and not the full month.
I don't know how the data is processed in Dashticz but to retrieve data from previous years / months from domoticz database.
Code: Select all
http://<domoticz ip: domoticz:port>/json.htm?actyear=<yyyy>&idx=<idx>&range=year&sensor=counter&type=graph
It's not a Domoticz limitation, but a Dashticz limitation.
range: This is the name of the range as requested from Domoticz, and can be 'day', 'today', 'month' or 'year'.
Naamloos 1.jpg
Now it looks like I almost didn't use gas in May 2020, but the value is just from today date till the end of the month.
This is something else that stumped me for a while. But I realized (as you did), it just looks back *exactly* one year (365 days) which means that the first bar is no longer accurate almost immediately after it is displayed....