Page 1 of 10
Dashticz Graphs - Features, Fixes & Updates
Posted: Saturday 29 February 2020 22:17
by clinkadink
Dashticz graphs have been updated this evening.
Fixed: undefined second Y axis added when 2 or more datasets present with the same unit of measure.
New:
groupByDevices
New graph block parameter added,
groupByDevice, allowing user to show the
live status of several devices in a single graph. Instead of the data being group by
time intervals, it is grouped by the
devices. Note, unlike other graphs, this type of graph does not report on historic data. I.e. there are no 'last', 'today', 'month' buttons.
- Spoiler: show
Code: Select all
blocks['server_status'] = {
    title: 'Server Status',
    devices: [17, 18, 189, 190, 192],
    groupByDevice: true,
    beginAtZero: true
}

The feature works with device sensors such as counter, percentage and temperature.
With temperature sensors that have setpoints, it calculates whether the device is:
The office and penthouse rooms are showing red, as the temperature is
above the setpoint ...
- Spoiler: show
Code: Select all
blocks['all_zones'] = {
   title: 'Room Temperatures',
   devices: [6, 11, 12, 8, 14, 9, 15, 235, 10, 13],
   groupByDevice: true,
   beginAtZero: true
}

Same as above, but setting
groupByDevice to
'horizontal' shows this ...
- Spoiler: show
Code: Select all
blocks['all_zones'] = {
   title: 'Room Temperatures',
   devices: [6, 11, 12, 8, 14, 9, 15, 235, 10, 13],
   groupByDevice: 'horizontal',
   beginAtZero: true
}

As always, with all updates to this beta, any feedback is appreciated

Re: Dashticz Graphs - New Features, Fixes & Updates
Posted: Sunday 01 March 2020 9:59
by EdwinK
Okay, this I got to work
Re: Dashticz Graphs - New Features, Fixes & Updates
Posted: Monday 02 March 2020 13:05
by Ewaldharmsen
I have a problem with graphs as defined in the manual:
This works:
Code: Select all
columns[3]['blocks'] = [
    'graph_6'
]
But adding this has no effect:
Code: Select all
blocks['graph_6'] = {
    graphTypes : ['te', 'hu'],
    legend: true
}
Any clue why?
Re: Dashticz Graphs - New Features, Fixes & Updates
Posted: Monday 02 March 2020 13:47
by HansieNL
Ewaldharmsen wrote: Monday 02 March 2020 13:05
I have a problem with graphs as defined in the manual:
This works:
Code: Select all
columns[3]['blocks'] = [
    'graph_6'
]
But adding this has no effect:
Code: Select all
blocks['graph_6'] = {
    graphTypes : ['te', 'hu'],
    legend: true
}
Any clue why?
Can you try to add:
devices: [6], to the block.
For latest manual see:
https://dashticz.readthedocs.io/en/beta ... raphs.html
Re: Dashticz Graphs - New Features, Fixes & Updates
Posted: Monday 02 March 2020 19:45
by Ewaldharmsen
thanks! I was looking at the maste documentation
Re: Dashticz Graphs - New Features, Fixes & Updates
Posted: Monday 02 March 2020 20:10
by Ewaldharmsen
I now have this:
Code: Select all
blocks['graph_5'] = {
	devices: [5,11],
	graphTypes : ['te', 'hu'],
	interval: 5,
	sortDevices: true,
	custom : {
		"Vandaag": {
			range: 'day',
			filter: '24 hours',
			data: {
				Outside: 'd.te_5',
				Inside: 'd.te_11',
				Humidity: 'd.hu_5'
			}
		},
	},
	height : '300px'
}
Some other questions:
1) I have one sensor which is not always on, so for instance 6hours of data is missing for d.te_11. Tos 6 hours are then not displayed at all, also not for d.te_5. How can I prevent that?
2) I now have one button "vandaag", can I hide that button?
Re: Dashticz Graphs - New Features, Fixes & Updates
Posted: Monday 02 March 2020 21:25
by clinkadink
1. You can use
spanGaps
- If true, lines will be drawn between points with no or null data
- If false, points with NaN data will create a break in the line (default)
2. You can hide the buttons group for that graph by adding this to your custom.css.
Code: Select all
[data-id='graph_5'] .graphbuttons {
   display: none;
}
Although this means you will not be able to use other buttons such as zoom and debug. If you want to hide individual buttons, instead of the whole button group, you will need to use this.
Code: Select all
[data-id='graph_5'] .graphbuttons:nth-child(1) {
   display: none;
}
The number in brackets is the button number you want to hide (1 being the first on the left).
Re: Dashticz Graphs - New Features, Fixes & Updates
Posted: Tuesday 03 March 2020 9:24
by Ewaldharmsen
Thanks!
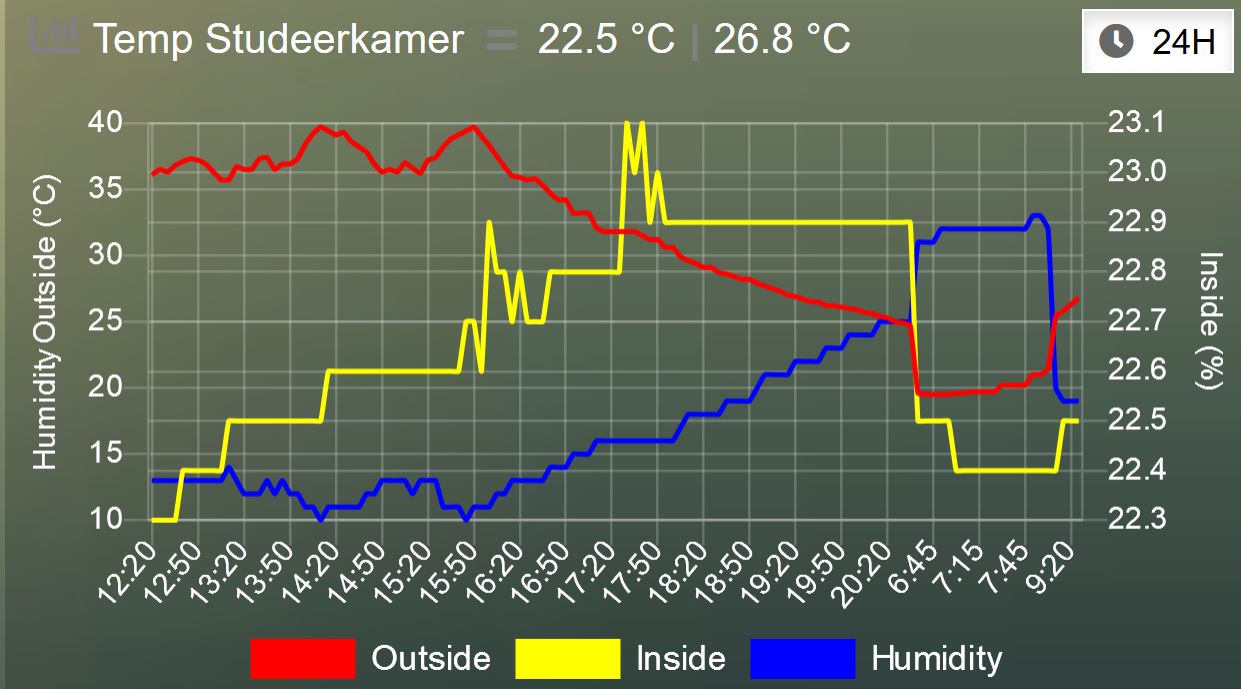
This works now, but spanGaps: doesnt do anything, I stil have a gap in my graph, even if I make it true:
Code: Select all
blocks['graph_5'] = {
	devices: [Temp_Studeerkamer,Weerstation],
	graphTypes : ['te', 'hu'],
	spanGaps: false,
	legend: {
      'te_5': 'Outside',
	  'te_11': 'Inside',
	  'hu_5': 'Humidity'
    },
	height : '300px'
}
- Working.JPG (108.66 KiB) Viewed 4914 times
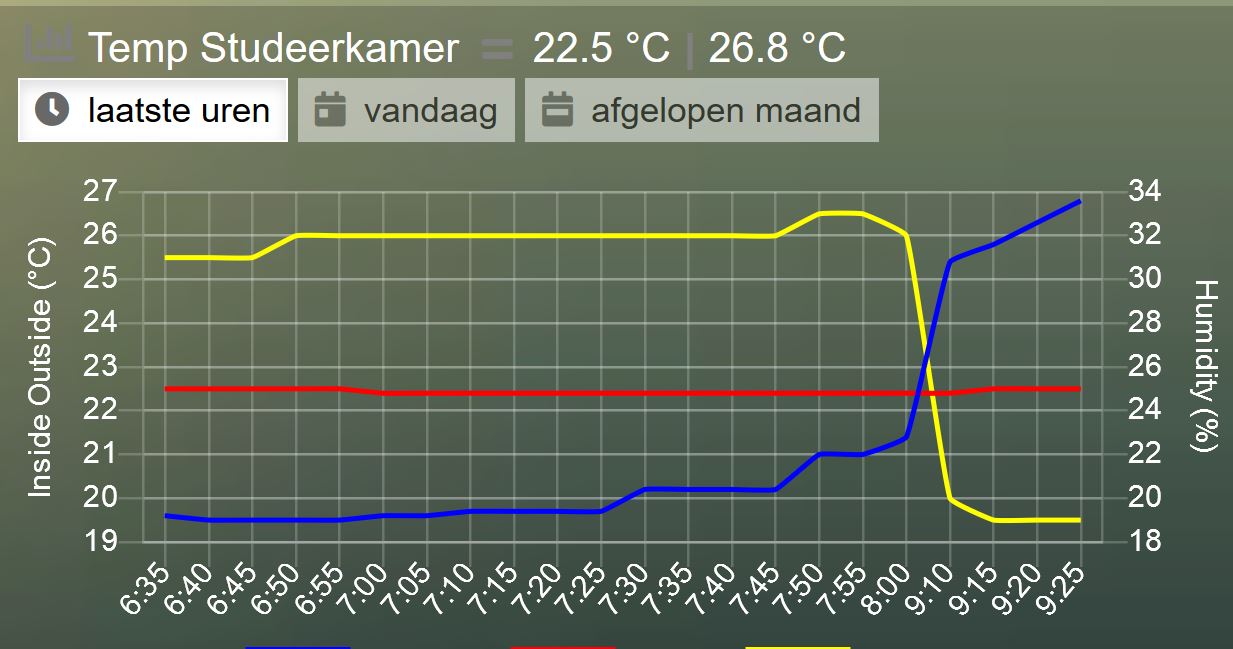
But I want "today" be te default not "Last hours"
This doesn't work:
Code: Select all
blocks['graph_5'] = {
	devices: [Temp_Studeerkamer,Weerstation],
	graphTypes : ['te', 'hu'],
	spanGaps: false,
	custom : {
		"24H": {
			range: 'day',
			filter: '24 hours',
			data: {
				Outside: 'd.te_5',
				Inside: 'd.te_11',
				Humidity: 'd.hu_5'
			}
		},
	},
	legend: {
      'te_5': 'Outside',
	  'te_11': 'Inside',
	  'hu_5': 'Humidity'
    },
	height : '300px'
}
If I do the above, it places the the inside temperature and humidity on the right y-ax and the outside temperature on the left y-ax.
see this:
- custom.JPG (112.92 KiB) Viewed 4914 times
If I add CSS:
Code: Select all
[data-id='graph_5'] .graphbuttons {
   display: none;
}
this is the result:
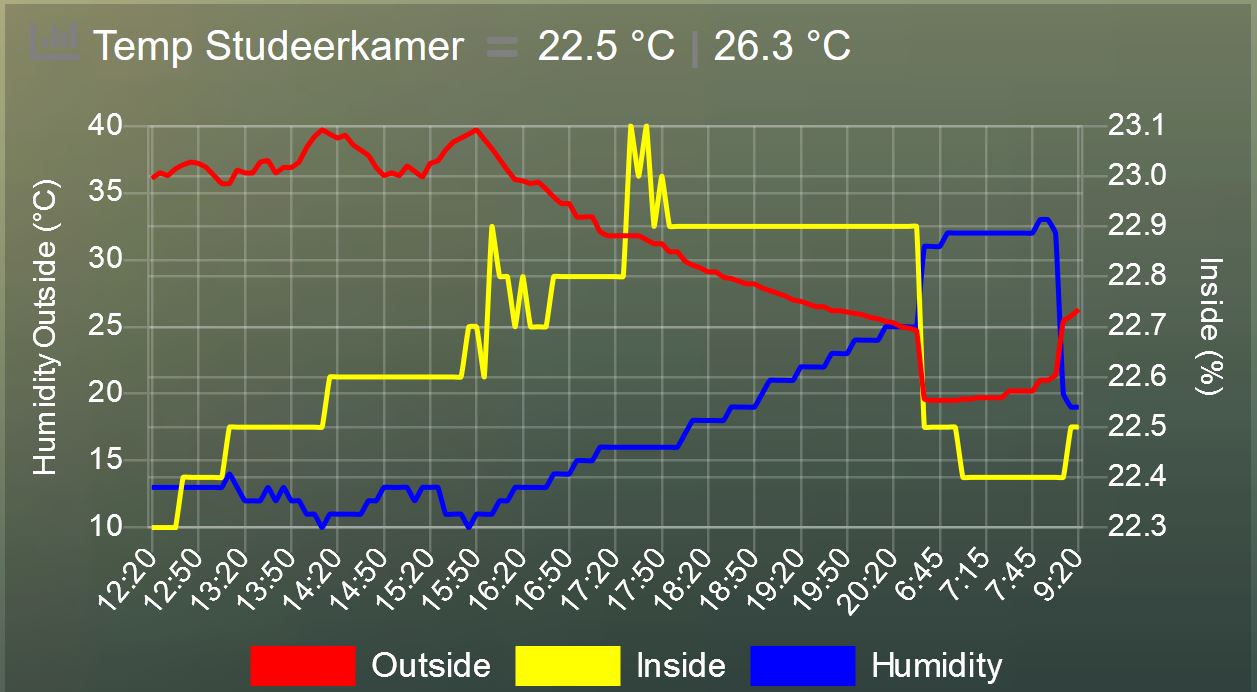
- css.JPG (117.86 KiB) Viewed 4914 times
Re: Dashticz Graphs - New Features, Fixes & Updates
Posted: Tuesday 03 March 2020 9:44
by EdwinK
EdwinK wrote: Sunday 01 March 2020 9:59
Okay, this I got to work
And finally I got the 'outside vs inside temp' graph to work as well. And I feel stupid for not finding it any sooner. Forgot to change the IDX in the script. Only changed it in the devices line.
Re: Dashticz Graphs - New Features, Fixes & Updates
Posted: Tuesday 03 March 2020 21:08
by clinkadink
Ewaldharmsen wrote: Tuesday 03 March 2020 9:24
This works now, but spanGaps: doesnt do anything, I stil have a gap in my graph, even if I make it true:
I cannot see any gaps in your lines, so I am not clear on what you are trying achieve.
Ewaldharmsen wrote: Tuesday 03 March 2020 9:24
But I want "today" be te default not "Last hours"
Ensure this is in your config.js
EdwinK wrote: Tuesday 03 March 2020 9:44
It places the the inside temperature and humidity on the right y-ax and the outside temperature on the left y-ax.
If you add custom data, you don't have to specify a custom legend too. Just try legend: true.
Ewaldharmsen wrote: Tuesday 03 March 2020 9:24
If I add CSS this is the result:
Is that not what you wanted?
Re: Dashticz Graphs - New Features, Fixes & Updates
Posted: Tuesday 03 March 2020 21:09
by clinkadink
EdwinK wrote: Tuesday 03 March 2020 9:44
And finally I got the 'outside vs inside temp' graph to work as well. And I feel stupid for not finding it any sooner. Forgot to change the IDX in the script. Only changed it in the devices line.
Great to hear, good catch
Re: Dashticz Graphs - New Features, Fixes & Updates
Posted: Wednesday 04 March 2020 9:49
by Ewaldharmsen
thank you very much!
I could not find
in the manual.
That one works now.
But the gap is there still, I highligted it in red:
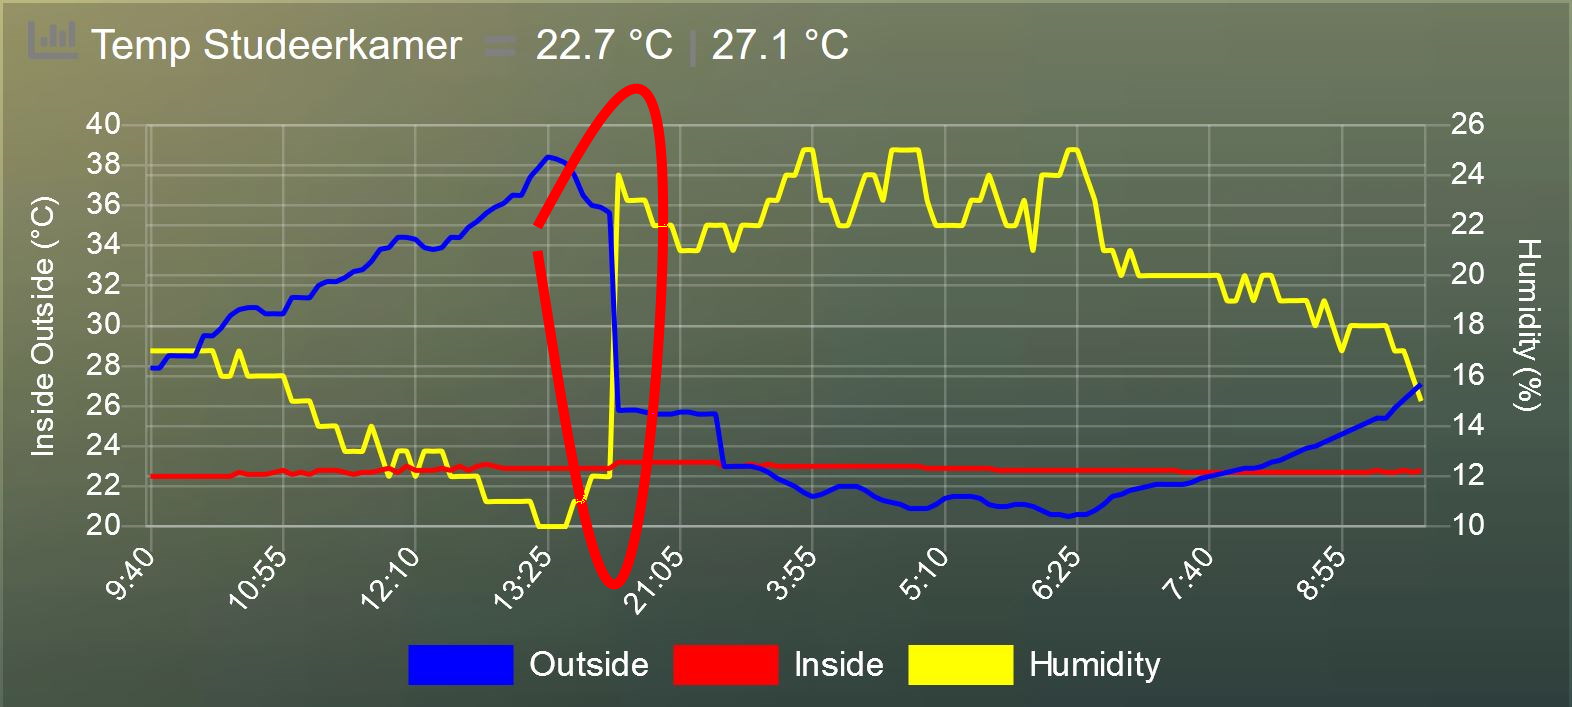
- gap.JPG (160.2 KiB) Viewed 4823 times
My current code is:
Code: Select all
blocks['temperature'] = {
	devices: [Temp_Studeerkamer,Weerstation],
	graphTypes : ['te', 'hu'],
	spanGaps: true,
	maxTicksLimit: 10,
	legend: {
     	 'te_5': 'Outside',
	  'te_11': 'Inside',
	  'hu_5': 'Humidity'
    },
	height : '300px'
}
Re: Dashticz Graphs - New Features, Fixes & Updates
Posted: Wednesday 04 March 2020 13:04
by clinkadink
Ewaldharmsen wrote: Wednesday 04 March 2020 9:49
But the gap is there still, I highligted it in red:
spanGaps will span any gaps (breaks) in a line. You do not have any gaps. The graph is accurately displaying the data provided from Domoticz. Understandably, If you want the graph to accurately report on the sensor for those 6 hours, the sensor needs to be on and providing data.
Re: Dashticz Graphs - New Features, Fixes & Updates
Posted: Wednesday 04 March 2020 14:58
by Ewaldharmsen
clinkadink wrote: Wednesday 04 March 2020 13:04
Ewaldharmsen wrote: Wednesday 04 March 2020 9:49
But the gap is there still, I highligted it in red:
spanGaps will span any gaps (breaks) in a line. You do not have any gaps. The graph is accurately displaying the data provided from Domoticz. Understandably, If you want the graph to accurately report on the sensor for those 6 hours, the sensor needs to be on and providing data.
I still quite get it. I have 2 sensors one of which is alwasy on. The other not. The data of my always-on sensor is not showing because the other sensor has missing data.
Re: Dashticz Graphs - New Features, Fixes & Updates
Posted: Friday 06 March 2020 22:41
by Janco
In many of the graphs above and also in my own Dashticz graphs I notice the following bugs(?):
- Humidity seems to be expressed in ºC and temperature in % (which can be solved by defining them yourselves, but still)
- beginAtZero only works for one of the axes (in case of multiple axis)
Re: Dashticz Graphs - New Features, Fixes & Updates
Posted: Friday 06 March 2020 22:54
by clinkadink
Janco wrote: Friday 06 March 2020 22:41
In many of the graphs above and also in my own Dashticz graphs I notice the following bugs(?):
- Humidity seems to be expressed in ºC and temperature in % (which can be solved by defining them yourselves, but still)
- beginAtZero only works for one of the axes (in case of multiple axis)
- Please post the debug log (debugButton: true), this will help trace the issue
- beginAtZero can be applied to multiple axes with custom data/options, I will also look to see if the block param can be improved
Re: Dashticz Graphs - New Features, Fixes & Updates
Posted: Saturday 07 March 2020 0:34
by Janco
This is the resulting file.
Don't pay too much attention to the array value for beginAtZero. I tried a simple value as well, no change.
Since not everything is documented, I sometimes use trial and error.
Log file:
block_49158.json.zip
Block definition:
- Spoiler: show
- blocks['outside_weather'] = {
debugButton: true,
title: 'Outside',
devices: [158, 161],
graphTypes: ['te', 'hu', 'ba'],
graph: ['line', 'line', 'line'],
beginAtZero: [true, true, true],
buttonsSize: 5,
buttonsText: ['1', '7'],
buttonsColor: 'green',
legend: true,
height: '185px',
lineTension: 0.4,
borderWidth: 2,
datasetColors: ['red', 'yellow', 'white'],
custom: {
"today": {
range: 'day',
filter: '24 hours',
data: {
Temperature: 'd.te_158',
Humidity: 'd.hu_158',
Pressure: 'd.ba_161'
}
},
"3 days": {
range: 'month',
filter: '14 days',
data: {
Temperature: 'd.te_158',
Humidity: 'd.hu_158',
Pressure: 'd.ba_161'
}
}
},
width: 12,
}
Re: Dashticz Graphs - New Features, Fixes & Updates
Posted: Saturday 07 March 2020 0:51
by clinkadink
That's your graph block from your config.js. What I meant is the debug file from the graph's 'debug button' itself.
More info can be found at this link:
https://www.domoticz.com/forum/viewtopi ... 60#p237106
Re: Dashticz Graphs - New Features, Fixes & Updates
Posted: Saturday 07 March 2020 8:08
by Janco
I know what mean. It's just that for some reason the debug file didn't upload (maybe because I made a draft first?).
Second attempt:
Re: Dashticz Graphs - New Features, Fixes & Updates
Posted: Saturday 07 March 2020 10:20
by clinkadink
Janco wrote: Saturday 07 March 2020 8:08
I know what mean. It's just that for some reason the debug file didn't upload (maybe because I made a draft first?).
Thanks for the log. I think I have found the issue, if I'm right, this only applies to graphs with multiple devices, each with multidata, but no Y labels specified in the custom data. I have tested my humidity/temp devices and the correct unit of measure is displayed.
As a test, please can you try changing this ...
- Spoiler: show
Code: Select all
"data": {
   "Temperature": "d.te_158",
   "Humidity": "d.hu_158",
   "Pressure": "d.ba_161"
}
To this ...
- Spoiler: show
Code: Select all
"data": {
   "Humidity": "d.hu_158",
   "Temperature": "d.te_158",
   "Pressure": "d.ba_161"
}
Please let me know if this corrects the Y axis label issue?