Rolling 24-hour graph using Google Charts and dzVents
Posted: Thursday 23 January 2020 12:19
For some time I had been looking for a way to produce a rolling, 24-hour composite graph showing multiple temperatures from Domoticz. Sure, you can create a Custom Graph from within the Temperatures tab in Domoticz, but this does not appear to be persistent, i.e., you need to create it every time you want to see it.
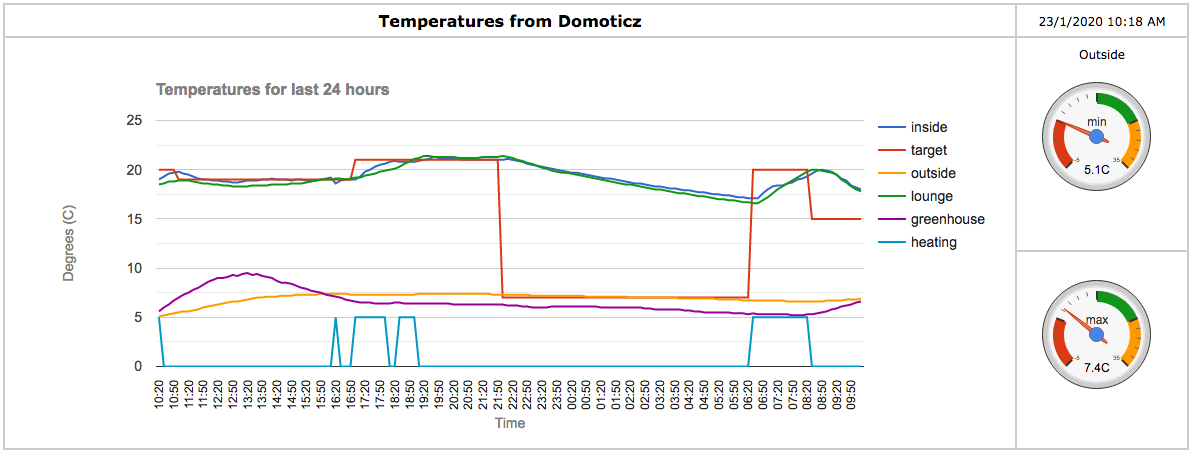
I then came across Google Charts, which has enabled me to produce such a graph in a separate webpage in my browser. Here's a sample:
 .
.
Data file
To produce this, I created a csv file with data from Domoticz every 10 minutes. I used a python script which adds the latest data and drops off the oldest data every 10 minutes (cron), thus maintaining 144 rows (24 x 6 per hour) plus header. For my requirement, the file looks like this:
Script to create data file
However, the Python script seemed very clunky, and I asked (in this forum) if there was a better way of doing this in dzVents. @waaren kindly responded, and has created a dzVents script here:
https://www.domoticz.com/forum/viewtopi ... 72&t=30993
This approach is more elegant, and more tightly integrated with Domoticz.
You can have as many or as few data series as you want (but not too many - the graph will get very busy!) - just amend the devicenames / methods in the script (dataTable[1], etc.).
Script to create graphs
The script to create the graphs, in the form of an html file with Javascript code and Google Charts commands is here:
You can hover over any series, and Google Charts will display values in tooltips.
There is a GetClock function within the script, which updates the webpage every 10 minutes (as data is only updated at the same rate).
Webserver
To display the graphs, I set up a webserver using nginx - see instructions for Raspberry Pi here:
https://www.raspberrypi.org/documentati ... r/nginx.md
I created a separate www folder, and saved the above chart script as index.html inside it. I also changed the location / name of the csv file in the dzVents script so that it creates the csv file within this folder. As per the nginx instructions, I changed the location of the webpage in /etc/nginx/sites-available/default.
So, in my setup I have created a folder /home/pi/devices/www, which contains:
The output line in the dzVents script is changed to:
and the webpage location in /etc/nginx/sites-available/default is changed to:
I apologise if this seems very long-winded - I will try and produce a TL;DR; version!
Anyway, if you find this useful or if you have any queries, please let me know.
I then came across Google Charts, which has enabled me to produce such a graph in a separate webpage in my browser. Here's a sample:
.Data file
To produce this, I created a csv file with data from Domoticz every 10 minutes. I used a python script which adds the latest data and drops off the oldest data every 10 minutes (cron), thus maintaining 144 rows (24 x 6 per hour) plus header. For my requirement, the file looks like this:
Code: Select all
now, inside, target, outside, lounge, greenhouse, heating
10:30,19.3,20.0,5.2,18.6,6.0,0
10:40,19.6,20.0,5.3,18.8,6.3,0
10:50,19.7,20.0,5.4,18.8,6.7,0
11:00,19.8,19.0,5.5,18.9,7.0,0
etc. (oldest data first)However, the Python script seemed very clunky, and I asked (in this forum) if there was a better way of doing this in dzVents. @waaren kindly responded, and has created a dzVents script here:
https://www.domoticz.com/forum/viewtopi ... 72&t=30993
This approach is more elegant, and more tightly integrated with Domoticz.
You can have as many or as few data series as you want (but not too many - the graph will get very busy!) - just amend the devicenames / methods in the script (dataTable[1], etc.).
Script to create graphs
The script to create the graphs, in the form of an html file with Javascript code and Google Charts commands is here:
- Spoiler: show
You can hover over any series, and Google Charts will display values in tooltips.
There is a GetClock function within the script, which updates the webpage every 10 minutes (as data is only updated at the same rate).
Webserver
To display the graphs, I set up a webserver using nginx - see instructions for Raspberry Pi here:
https://www.raspberrypi.org/documentati ... r/nginx.md
I created a separate www folder, and saved the above chart script as index.html inside it. I also changed the location / name of the csv file in the dzVents script so that it creates the csv file within this folder. As per the nginx instructions, I changed the location of the webpage in /etc/nginx/sites-available/default.
So, in my setup I have created a folder /home/pi/devices/www, which contains:
Code: Select all
index.html
temps_daily.csv
Code: Select all
local output = '/home/pi/devices/temps_daily.csv' -- location/name of your csv text file
Code: Select all
root /home/pi/devices/www;
Anyway, if you find this useful or if you have any queries, please let me know.