Create rolling CSV file with dzVents
Posted: Wednesday 08 January 2020 19:44
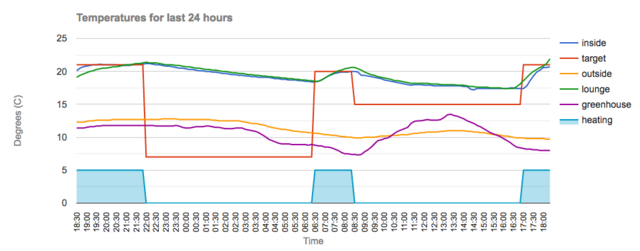
I currently create rolling 24-hour graphs of Domoticz data (temperature, power) using Google Charts with a csv file created from a python script.
The python script is very clunky - it runs every 10 minutes (cron), reading data from Domoticz (using the JSON API) for 6 devices, uses the python pop command to remove the oldest row from the file, and then creates a new row (at the end of the file) with the latest data. Here's a snippet of the code:
The python script is very clunky - it runs every 10 minutes (cron), reading data from Domoticz (using the JSON API) for 6 devices, uses the python pop command to remove the oldest row from the file, and then creates a new row (at the end of the file) with the latest data. Here's a snippet of the code:
- Spoiler: show