Hi
1. What I mean with:
Do not forget to enable "New Hardware" in your Master.
is the following:
In "Setup" => "Settings", you have the following option:
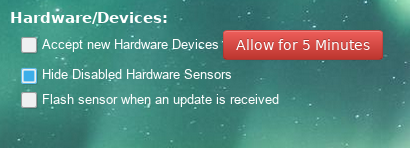
- Checkbox_Enable_hardware.png (69.95 KiB) Viewed 5895 times
Click the checkbox, marked "Accept new Hardware Devices" or click "Allow for 5 Minutes".
And don't forget in "Setup" => "Devices" to click the green arrow for your devices, so that it turns to blue
Otherwise you will not see the devices under the "Temperature" and "Utility" tab.
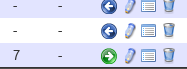
- Add_devices.png (4.29 KiB) Viewed 5895 times
You asked:
But looking the log on slave side I can see only one incoming connection : this is the connection of my laptop.
2019-12-04 08:07:06.763 Status: Incoming connection from: 192.168.1.47
Should I see the master's connection (192.168.1.39) or is it treated separately?
Yes, if you startup the Domoticz process in your slave you should see in "All" the following:
Code: Select all
2019-12-04 13:41:27.507 Sunrise: 08:28:00 SunSet: 16:28:00
2019-12-04 13:41:27.507 Day length: 07:60:00 Sun at south: 12:28:00
2019-12-04 13:41:27.507 Civil twilight start: 07:48:00 Civil twilight end: 17:08:00
2019-12-04 13:41:27.507 Nautical twilight start: 07:05:00 Nautical twilight end: 17:51:00
2019-12-04 13:41:27.507 Astronomical twilight start: 06:24:00 Astronomical twilight end: 18:32:00
2019-12-04 13:41:26.989 Status: Domoticz V4.11549 (c)2012-2019 GizMoCuz
2019-12-04 13:41:27.003 Status: Build Hash: 132e26f88, Date: 2019-12-04 11:18:39
2019-12-04 13:41:27.008 Status: Startup Path: /home/pi/domoticz/
2019-12-04 13:41:28.706 Active notification Subsystems: email (1/13)
2019-12-04 13:41:28.757 Starting shared server on: :::6144
2019-12-04 13:41:28.639 Status: PluginSystem: Started, Python version '3.5.3'.
2019-12-04 13:41:28.713 Status: WebServer(HTTP) started on address: :: with port 8080
2019-12-04 13:41:28.738 Status: WebServer(SSL) started on address: :: with port 443
2019-12-04 13:41:28.760 Status: TCPServer: shared server started...
2019-12-04 13:41:28.761 Status: RxQueue: queue worker started...
2019-12-04 13:41:30.766 Status: Hardware Monitor: Started
2019-12-04 13:41:30.798 Status: EventSystem: reset all events...
2019-12-04 13:41:30.800 Status: EventSystem: reset all device statuses...
2019-12-04 13:41:31.033 Status: PluginSystem: Entering work loop.
2019-12-04 13:41:31.672 Status: Python EventSystem: Initalizing event module.
2019-12-04 13:41:31.675 Status: EventSystem: Queue thread started...
2019-12-04 13:41:31.676 Status: EventSystem: Started
2019-12-04 13:41:57.792 Status: Incoming Domoticz connection from: 192.168.10.50
2019-12-04 13:43:48.789 Status: Incoming connection from: 127.0.0.1
2019-12-04 14:00:00.958 Status: Starting automatic database backup procedure...
2019-12-04 14:00:01.872 Status: Ending automatic database backup procedure...
In my case the "Master" has IP address: 192.168.10.50.
On the "Master", you see a line in the log, like:
2019-12-04 13:43:55.057 Status: Domoticz Remote: connected to: 192.168.10.51:6144
In my case the "Slave" has IP address: 192.168.10.51.
So in both machines you should see, that the "Master" is connected to the "Slave".
If the "Master" is updated, you should see in the "Master" log, lines, like:
2019-12-04 13:46:36.203 (Raspberry Pi 1) General/Percentage (Raspberry Pi 1 CPU_Usage)
2019-12-04 13:48:06.399 (Raspberry Pi 1) Temp (Raspberry Pi 1 Int. Temperature)
2019-12-04 13:48:06.416 (Raspberry Pi 1) General/Percentage (Raspberry Pi 1 CPU_Usage)
2019-12-04 13:49:36.558 (Raspberry Pi 1) General/Percentage (Raspberry Pi 1 HDD /boot)
2019-12-04 13:49:36.581 (Raspberry Pi 1) General/Percentage (Raspberry Pi 1 HDD /)
(Raspberry Pi 1 is the name of my "Slave")
You don't see anything on your "Slave".
So obviously, as you see only the connection of your laptop and not the Incoming Domoticz connection from your Domoticz "Master", I think that the connection not has been made. Strange.
Is there anything in your "Slave" that may prevent, that a connection is made?
Regards