Page 1 of 1
Improve scaling of graphs.
Posted: Sunday 21 April 2019 21:35
by Bochelork
My temperature history graph has a minimum of -6 degrees and a maximum of 43 degrees. The temperature scale goes from -60 to 60 degrees. So it's a range of 120 degrees while only 50 degrees is needed. Graphs are very flat this way. Maybe round the top and bottom to 10 degrees, so in my case let the scale go from -10 to 50 degrees.
Re: Improve scaling of graphs.
Posted: Sunday 21 April 2019 22:01
by Antori91
+1
Re: Improve scaling of graphs.
Posted: Monday 29 April 2019 12:19
by JanAtHome
+1
Re: Improve scaling of graphs.
Posted: Sunday 05 May 2019 0:37
by Xztraz
i tried doing something abut this a couple of years ago but the framework for the graphs was a bit buggy and didn't allow for better combined ranges for temp and humidity ins the same graph. maybe the graph framework have been updated since then?
Re: Improve scaling of graphs.
Posted: Sunday 05 May 2019 9:06
by gizmocuz
I think we can assign a min and max value to the graph like is done for the voltage graph for example...
Re: Improve scaling of graphs.
Posted: Sunday 05 May 2019 12:10
by gizmocuz
Okey, seems this was done in the past...
We can configure the chart with some options:
alignTicks: false,
tickInterval: 0.5
This results in:

- temp1.png (82.78 KiB) Viewed 2078 times
but now when enabling the Humidity the result is maybe a bit messy with the grid lines:

- temp2.png (101.58 KiB) Viewed 2078 times
We can hide the gridlines always from the Humidity graph:

- temp3.png (93.77 KiB) Viewed 2078 times
Without temp the humidity would then look like:

- temp4.png (73.63 KiB) Viewed 2078 times
Whats preferred ? (ps. the 120% is still considered to be a bug in highchart...)
Re: Improve scaling of graphs.
Posted: Sunday 05 May 2019 21:30
by Xztraz
i think another option is to not show the grid lines for example humidity but stil show a scale for that. but then the lines will only align to temperature scale. i fighted with this before and then i considered readable scale lines as more important than 100%. but thats just my opinion among a lot of others regarding graphs.

maybe a bug report in their github would be best. i only reported in their forum
Re: Improve scaling of graphs.
Posted: Sunday 05 May 2019 21:40
by Xztraz
i see they have a bunch of bugs regarding autoscaling, ticks and so on and they don't seem high priority.
Re: Improve scaling of graphs.
Posted: Monday 06 May 2019 10:14
by Antori91
Hello,
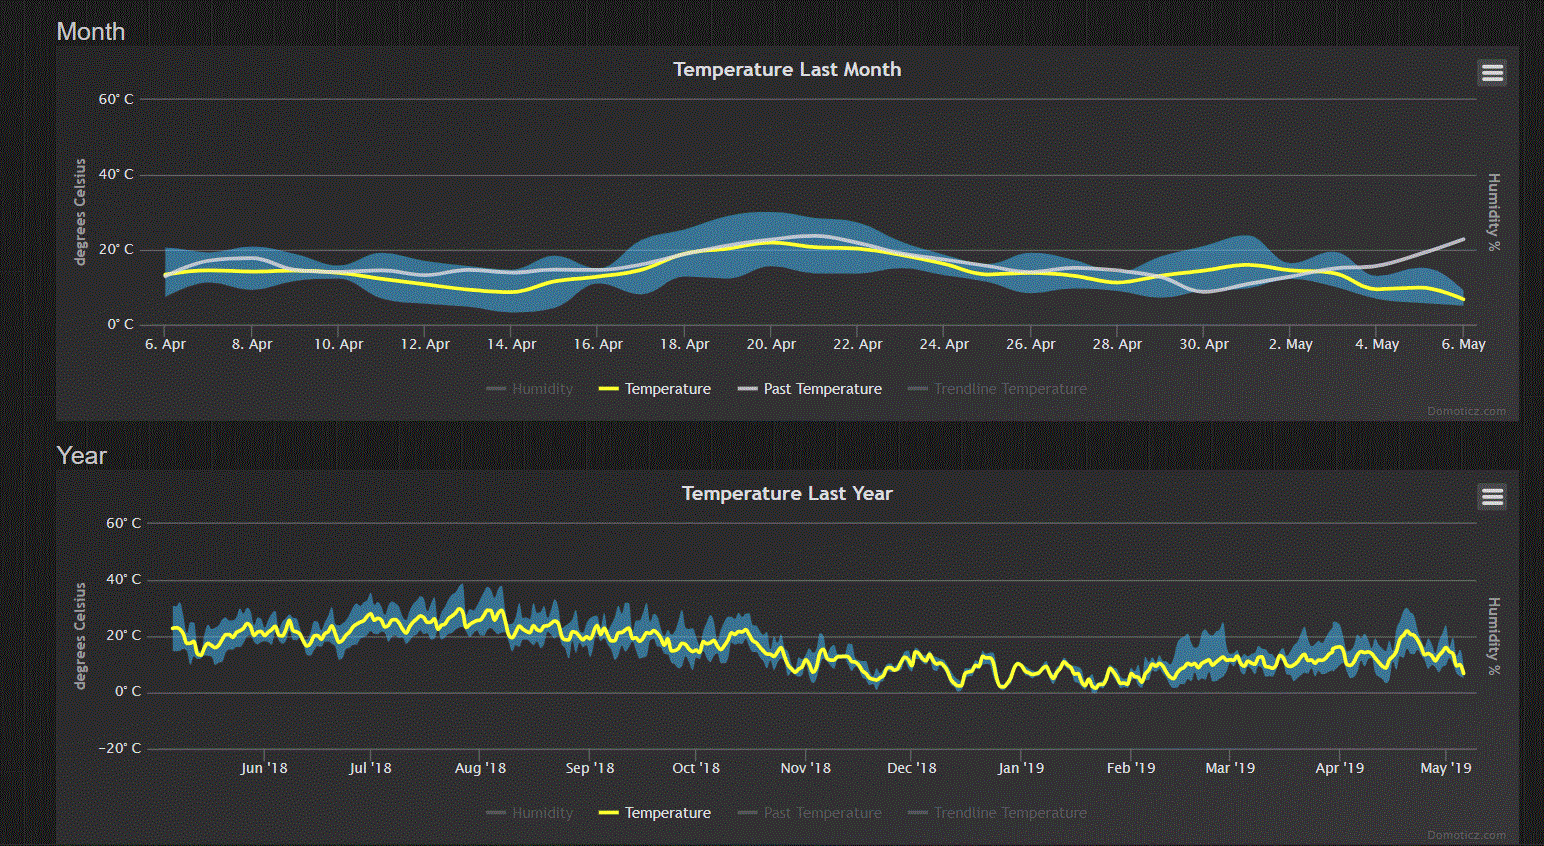
I don't use very often graphs with Humidity value. Below are two examples with temperature only. To have usable graphs, the scale of the temperature graphs should be set (I think) accordingly to the min/max of the temperature. For example, for the "Temperature Last Year" graph below, the scale should be between 0°C and +30°C and not between -20°C and + 60°C.

- Capture.GIF (307.62 KiB) Viewed 2052 times
Re: Improve scaling of graphs.
Posted: Monday 06 May 2019 15:35
by Xztraz
same kind of bug regarding temperature scale in graph framework
Re: Improve scaling of graphs.
Posted: Tuesday 07 April 2020 14:15
by Antori91
Hello,
Is there any improvement regarding this issue using the latest release?