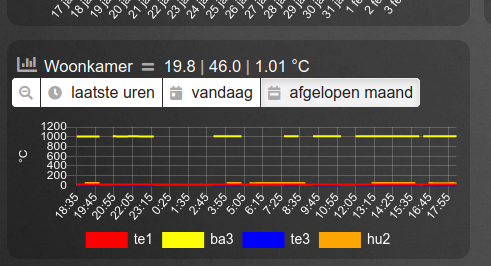
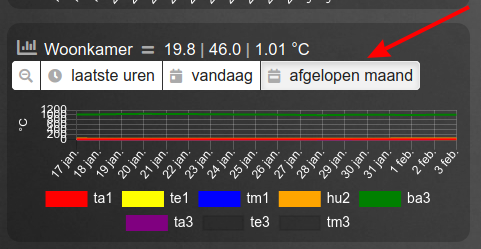
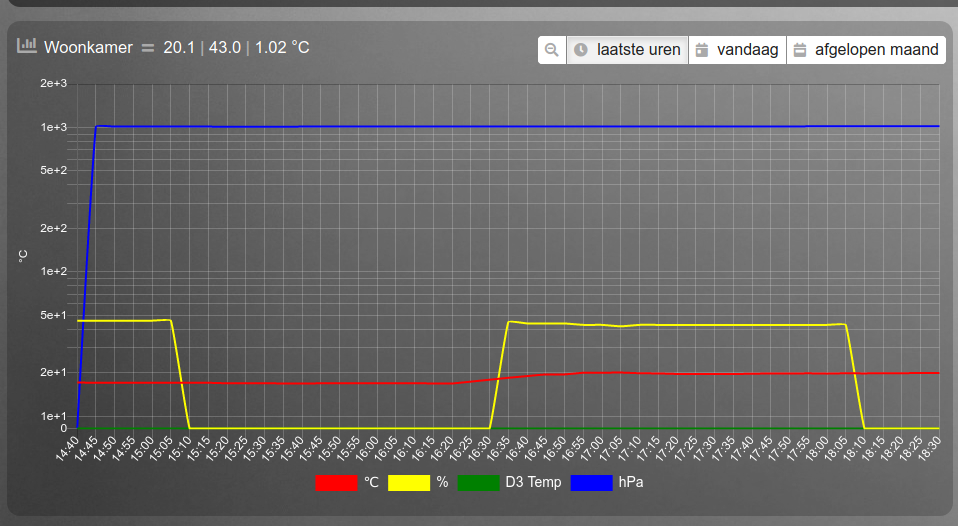
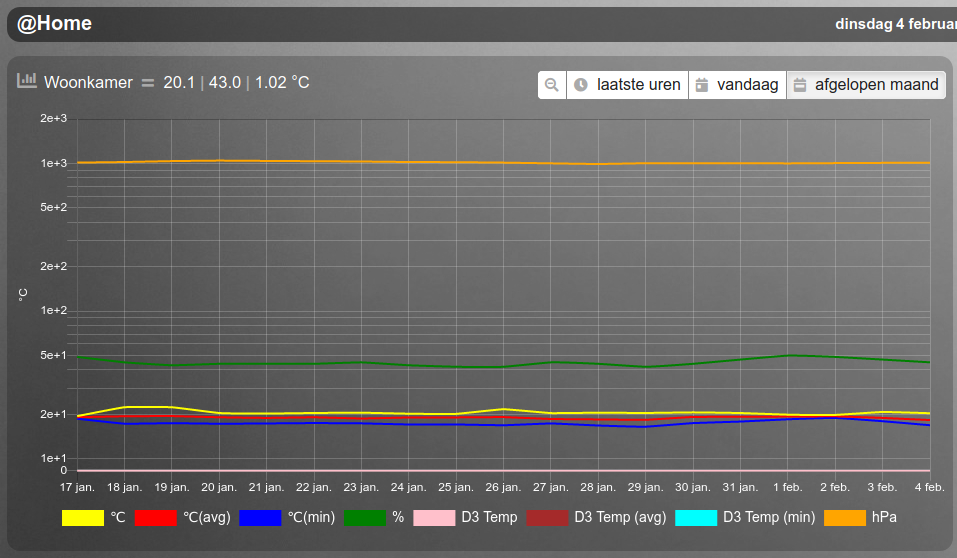
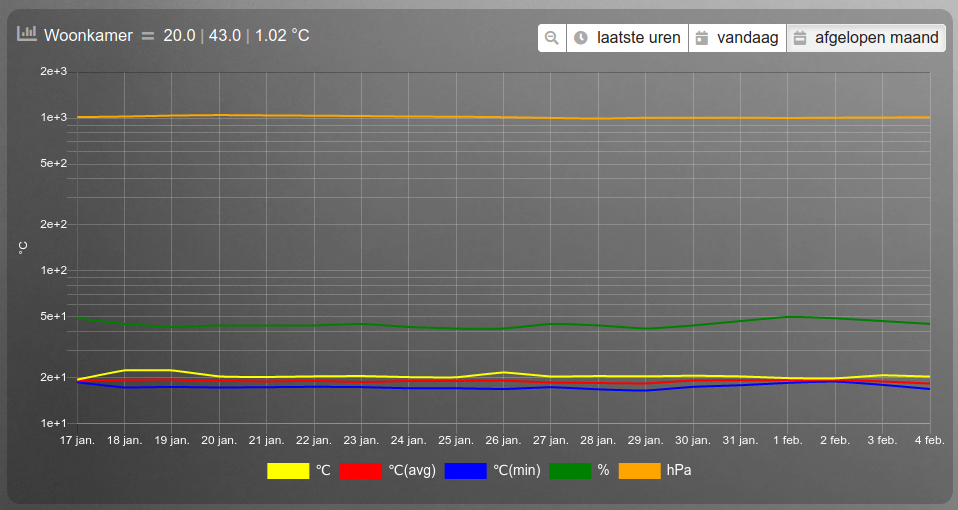
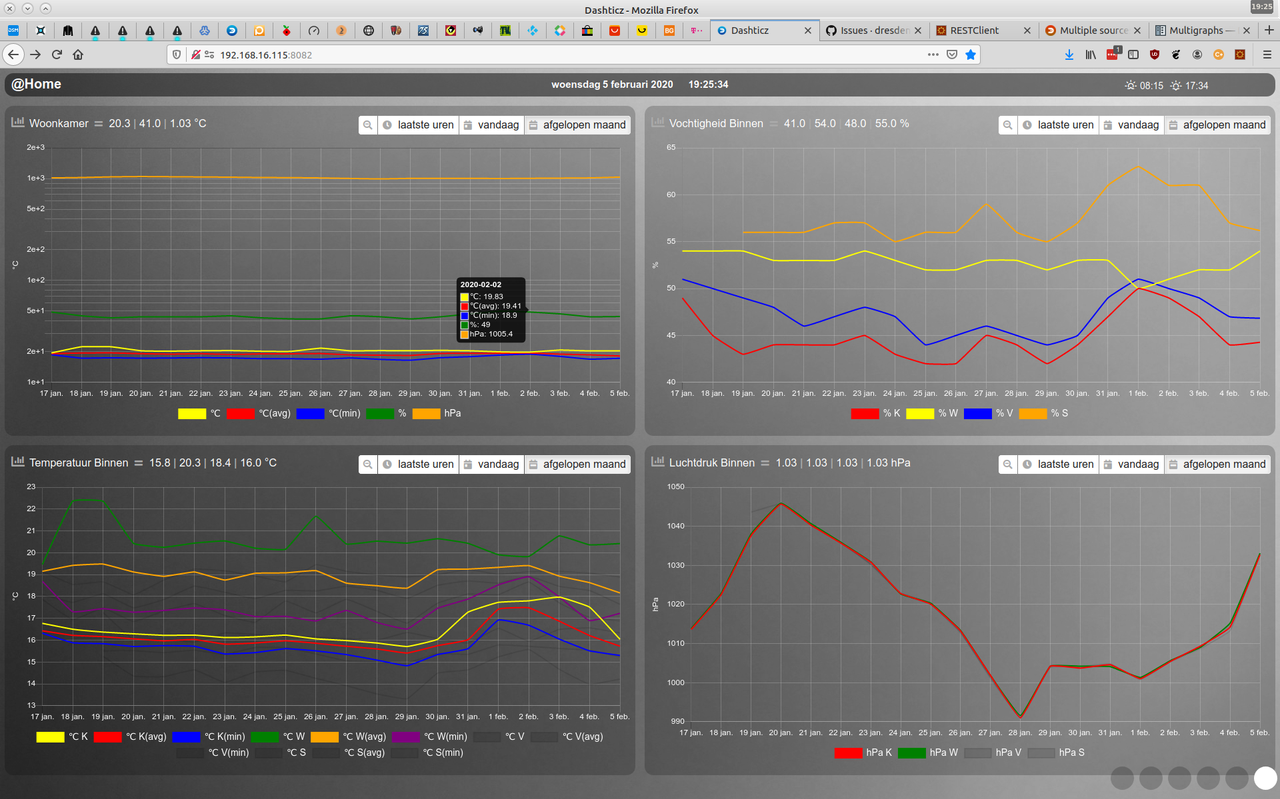
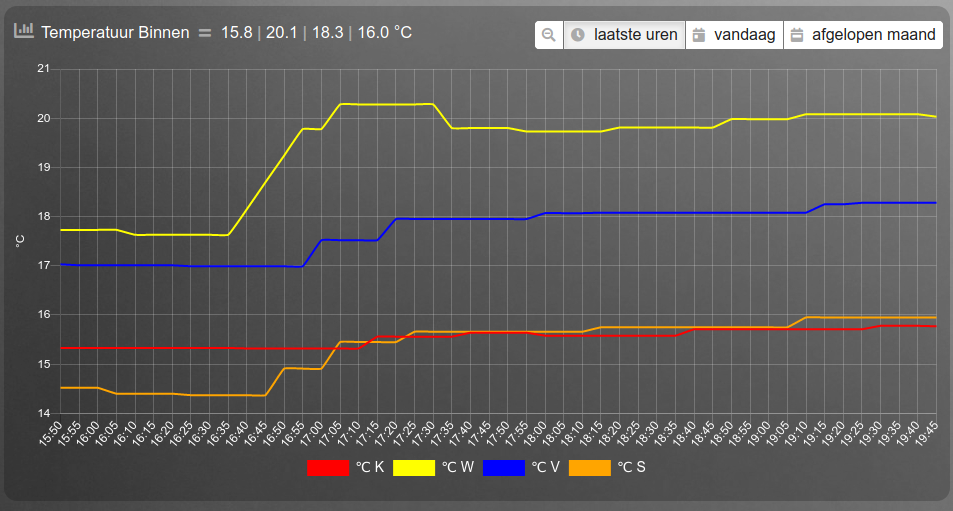
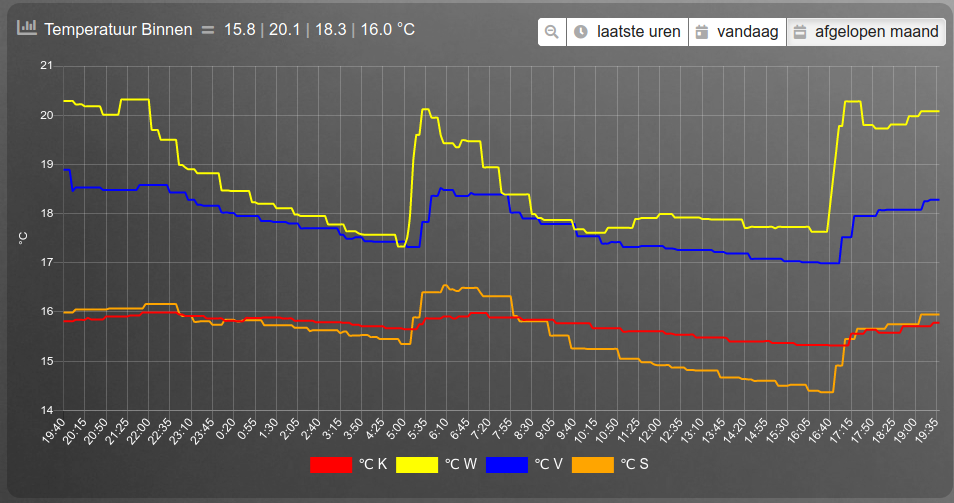
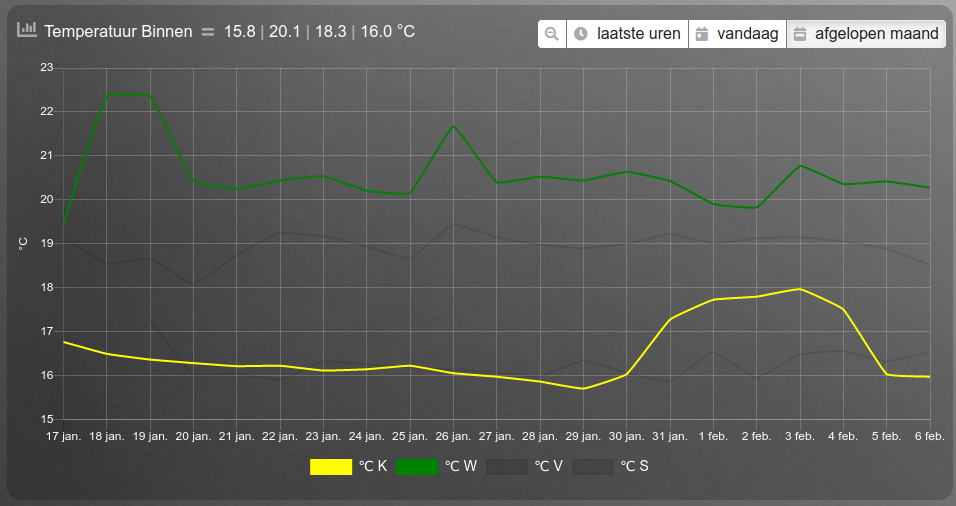
Custom data structure remains unchanged from the standard graph. More information can be found in the help documentation.
https://dashticz.readthedocs.io/en/beta ... tom-graphs
"se" is the key within the data that is returned from Domoticz for "setpoint". You can view the data being returned from Domoticz via these urls:
Data for a "day":
http://127.0.0.1:8080/json.htm?type=gra ... y&method=1
Data for a "month":
http://127.0.0.1:8080/json.htm?type=gra ... h&method=1
Note: the month data returns more keys than the day, as the month includes min, max and average for each dataset (e.g. temp and setpoint).
You have "d" for date/time (in all devices data), then key value pairs; in this case "se" (setpoint) and the value, then "te" (temp) and the value.
Code: Select all
{
   "result" : [
      {
         "d" : "2020-01-23 10:25",
         "se" : 22.0,
         "te" : 21.5
      },
      {
         "d" : "2020-01-23 10:30",
         "se" : 22.0,
         "te" : 21.5
      },
     // etc ....
}Graphs and multigraphs are created using JSON data, which does not allow duplicate keys in the same time object. If the multigraph code just added all data from all devices, the resulting data would result in duplicate keys - which is invalid JSON, and therefore, would not work.
For example, this would never work due to duplicate keys "se" and "te":
Code: Select all
      {
         "d" : "2020-01-23 10:25",
         "se" : 22.0, <---- device 1 setpoint
         "te" : 21.5, <---- device 1 temperature
         "se" : 24.0, <---- device 2 setpoint
         "te" : 22.5, <---- device 2 temperature
},Code: Select all
      {
         "d" : "2020-01-23 10:25",
         "se1" : 22.0, <---- device 1 setpoint
         "te1" : 21.5, <---- device 1 temperature
         "se2" : 24.0, <---- device 2 setpoint
         "te2" : 22.5, <---- device 2 temperature
},Hope that makes sense.


