Page 4 of 10
Re: Dashticz Graphs - New Features, Fixes & Updates
Posted: Friday 03 April 2020 21:22
by Lokonli
clinkadink wrote: Friday 03 April 2020 20:21
Thanks, its still work in progress, so I am very grateful for any feedback to help make it better

I have just looked at the graph code, please can you try adding this to your config.js?
Code: Select all
config["calendarlanguage"] = 'sv_SE';
I am not sure why it is using the 'calendar language', and not the 'language'. I can correct that, but for now, if you can test the above line, that would be great.
calendar.js, line 60:
moment.locale(settings['calendarlanguage']);
Re: Dashticz Graphs - New Features, Fixes & Updates
Posted: Friday 03 April 2020 21:28
by Minglarn
There was a duplicate line with language config.
Corrected and now it works.

Re: Dashticz Graphs - New Features, Fixes & Updates
Posted: Friday 03 April 2020 23:01
by clinkadink
Minglarn wrote: Friday 03 April 2020 21:28
There was a duplicate line with language config.
Corrected and now it works.
Do you mean your own config.js or the Dashticz language config?
Re: Dashticz Graphs - New Features, Fixes & Updates
Posted: Friday 03 April 2020 23:20
by Minglarn
clinkadink wrote: Friday 03 April 2020 23:01
Minglarn wrote: Friday 03 April 2020 21:28
There was a duplicate line with language config.
Corrected and now it works.
Do you mean your own config.js or the Dashticz language config?
My own...
Re: Dashticz Graphs - New Features, Fixes & Updates
Posted: Friday 03 April 2020 23:22
by clinkadink
Minglarn wrote: Friday 03 April 2020 23:20
clinkadink wrote: Friday 03 April 2020 23:01
Minglarn wrote: Friday 03 April 2020 21:28
There was a duplicate line with language config.
Corrected and now it works.
Do you mean your own config.js or the Dashticz language config?
My own...
Phew

Re: Dashticz Graphs - New Features, Fixes & Updates
Posted: Saturday 04 April 2020 0:13
by toro
Hi, really love all the new stuff in the graphs! Thanks!!
Small problem now however. I am on 3.4.2.
I want to show the legend, with custom names.
If I put this in the config, it shows the default legend (as expected)
Code: Select all
blocks['graph_202'] = {
    devices: [202],
	graphTypes : ['v', 'v2'],
	legend: true,
}
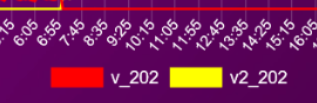
- legend.png (27.01 KiB) Viewed 2937 times
But when I use this, Dashticz won't start (Error in config.js)
Code: Select all
blocks['graph_202'] = {
    devices: [202],
	graphTypes : ['v', 'v2'],
	legend: {
		'v_202': 'Dal tarief',
		'v2_202': 'Normaal tarief'
	}
}
I am doing something wrong or is this a bug?
Dashticz Graphs - New Features, Fixes & Updates
Posted: Saturday 04 April 2020 9:53
by Alfagek
@toro
Try this
Code: Select all
blocks['graph_202'] = {
    devices: [202],
	graphTypes : ['v', 'v2'],
	legend: true,
	legend: {
		'v_202': 'Dal tarief',
		'v2_202': 'Normaal tarief'
	}
}
Re: Dashticz Graphs - New Features, Fixes & Updates
Posted: Saturday 04 April 2020 9:53
by Minglarn
Question...
Realy like the GRAP funktion.. Smooth and nice...
Is there an option to rename the devices as they show up in the graph, I want them to show as there are named in Domoticz.
Graph block:
Code: Select all
blocks['all_zones'] = {
   title: 'Room Temperatures',
   devices: [1831,2358,3016,1115,2887,2396],
   groupByDevice: 'horizontal',
   graphTypes: ['te']
};
Code: Select all
blocks[1831] = {title: 'Groventre', width:3};
As you can seem the 1831device is named "Groventre" in Dashticz but shows up as "Groventre (HUE)" in the graph..
Re: Dashticz Graphs - New Features, Fixes & Updates
Posted: Saturday 04 April 2020 10:23
by clinkadink
toro wrote: Saturday 04 April 2020 0:13
If I put this in the config, it shows the default legend (as expected)
- Spoiler: show
Code: Select all
blocks['graph_202'] = {
    devices: [202],
	graphTypes : ['v', 'v2'],
	legend: true,
}
But when I use this, Dashticz won't start (Error in config.js)
- Spoiler: show
Code: Select all
blocks['graph_202'] = {
    devices: [202],
	graphTypes : ['v', 'v2'],
	legend: {
		'v_202': 'Dal tarief',
		'v2_202': 'Normaal tarief'
	}
}
I am doing something wrong or is this a bug?
Your last graph block works fine for me, there are no errors with it. The graph displays correctly. Please can you post your config.js (redacted)?
Re: Dashticz Graphs - New Features, Fixes & Updates
Posted: Saturday 04 April 2020 10:29
by clinkadink
Minglarn wrote: Saturday 04 April 2020 9:53
Is there an option to rename the devices as they show up in the graph, I want them to show as there are named in Domoticz.
- Spoiler: show
Code: Select all
blocks['all_zones'] = {
   title: 'Room Temperatures',
   devices: [1831,2358,3016,1115,2887,2396],
   groupByDevice: 'horizontal',
   graphTypes: ['te']
};
Code: Select all
blocks[1831] = {title: 'Groventre', width:3};
As you can seem the 1831device is named "Groventre" in Dashticz but shows up as "Groventre (HUE)" in the graph..
I have raised this as a feature request here:
https://www.domoticz.com/forum/viewtopi ... 78&t=32026
Re: Dashticz Graphs - New Features, Fixes & Updates
Posted: Saturday 04 April 2020 10:57
by Minglarn
clinkadink wrote: Saturday 04 April 2020 10:29
Minglarn wrote: Saturday 04 April 2020 9:53
Is there an option to rename the devices as they show up in the graph, I want them to show as there are named in Domoticz.
- Spoiler: show
Code: Select all
blocks['all_zones'] = {
   title: 'Room Temperatures',
   devices: [1831,2358,3016,1115,2887,2396],
   groupByDevice: 'horizontal',
   graphTypes: ['te']
};
Code: Select all
blocks[1831] = {title: 'Groventre', width:3};
As you can seem the 1831device is named "Groventre" in Dashticz but shows up as "Groventre (HUE)" in the graph..
I have raised this as a feature request here:
https://www.domoticz.com/forum/viewtopi ... 78&t=32026
Nice!
Great work btw with the GRAPH... Makes everything so easy...
Again... Big Thanks!
Re: Dashticz Graphs - New Features, Fixes & Updates
Posted: Saturday 04 April 2020 11:03
by clinkadink
Minglarn wrote: Saturday 04 April 2020 10:57
clinkadink wrote: Saturday 04 April 2020 10:29
Minglarn wrote: Saturday 04 April 2020 9:53
Is there an option to rename the devices as they show up in the graph, I want them to show as there are named in Domoticz.
- Spoiler: show
Code: Select all
blocks['all_zones'] = {
   title: 'Room Temperatures',
   devices: [1831,2358,3016,1115,2887,2396],
   groupByDevice: 'horizontal',
   graphTypes: ['te']
};
Code: Select all
blocks[1831] = {title: 'Groventre', width:3};
As you can seem the 1831device is named "Groventre" in Dashticz but shows up as "Groventre (HUE)" in the graph..
I have raised this as a feature request here:
https://www.domoticz.com/forum/viewtopi ... 78&t=32026
Nice!
Great work btw with the GRAPH... Makes everything so easy...
Again... Big Thanks!
Good, i'm glad you like it. Like you, I want any easy, clean way to see my data. I am trying to add functionality that will benefit everyone. If you can think of anything else, just raise a feature request
Re: Dashticz Graphs - New Features, Fixes & Updates
Posted: Saturday 04 April 2020 18:05
by toro
clinkadink wrote: Saturday 04 April 2020 10:23
toro wrote: Saturday 04 April 2020 0:13
If I put this in the config, it shows the default legend (as expected)
- Spoiler: show
Code: Select all
blocks['graph_202'] = {
    devices: [202],
	graphTypes : ['v', 'v2'],
	legend: true,
}
But when I use this, Dashticz won't start (Error in config.js)
- Spoiler: show
Code: Select all
blocks['graph_202'] = {
    devices: [202],
	graphTypes : ['v', 'v2'],
	legend: {
		'v_202': 'Dal tarief',
		'v2_202': 'Normaal tarief'
	}
}
I am doing something wrong or is this a bug?
Your last graph block works fine for me, there are no errors with it. The graph displays correctly. Please can you post your config.js (redacted)?
Thank you so much for testing!
Because the graph works for you, I tried some more and figured it out.
In my code pasted above, I didn't paste all of the code in the block to make it more readable.
So in my block, there are more options.
All I had to do was add a comma after the }
I feel so stupid now. Tried a lot of things before posting, so why not this, pffff.
Thanks again, love this graphs!!
Re: Dashticz Graphs - New Features, Fixes & Updates
Posted: Saturday 04 April 2020 19:52
by clinkadink
toro wrote: Saturday 04 April 2020 18:05
Thank you so much for testing!
Because the graph works for you, I tried some more and figured it out.
In my code pasted above, I didn't paste all of the code in the block to make it more readable.
So in my block, there are more options.
All I had to do was add a comma after the }
I feel so stupid now. Tried a lot of things before posting, so why not this, pffff.
Thanks again, love this graphs!!
Don't worry, we've all been there, done that. Glad its working
Re: Dashticz Graphs - Features, Fixes & Updates
Posted: Saturday 11 April 2020 14:53
by clinkadink
Graphs has received an update today in the latest beta.
The "toolTipStyle" graph block parameter has been removed. This enables the enhanced graph tooltip when hovering above the graph. This is now enabled by default. The basic tooltip has been decommissioned. Please update your graph blocks by removed any instances of "toolTipStyle".
A new parameter has been added, "tooltiptotal", which accepts boolean (true or false) or array (['a', 'b', 'c']). When enabled it will add a "Total" value to the bottom of the tooltip, showing the total of all values.
For example, any of these:
Code: Select all
tooltiptotal: false,   					<--- This will not show a total
tooltiptotal: true,					<--- This will show a total of all other values in the tooltip
tooltiptotal: ['Electric Day', 'Electric Night'],	<--- This will only total the values specified
Any value that is being 'totalled' will show a plus icon (+).
Examples:


Code: Select all
tooltiptotal: ['Confirmed (Total)', 'Deaths (Total)'],

Notice above (in the last screenshot), only those datasets that have been specified in the "tooltiptotal" have been included in the total. As such, they have plus signs next to them.
If there are any issues or questions, I am sure you will let me know

Re: Dashticz Graphs - Features, Fixes & Updates
Posted: Thursday 23 April 2020 16:00
by JanvdW
Just implemented groupByDevices for my Evohome devices. Nice stuff and great that colouring is related to set points. In case that the temperature is above set the point (red coloured) I would like to see if Evohome will turn on in a second or that heating in that room is switched off. The graph doesn't show that at all. I was wondering if I can add a line graph that presents the set points for these devices? Has anyone ideas how to do that?
Another idea: it would be nice if you can choose your own colours. In my case I normally use red as an 'alarm' colour, but it's fine to me if no heating is needed
Re: Dashticz Graphs - Features, Fixes & Updates
Posted: Saturday 25 April 2020 12:38
by clinkadink
JanvdW wrote: Thursday 23 April 2020 16:00
In case that the temperature is above set the point (red coloured) I would like to see if Evohome will turn on in a second or that heating in that room is switched off. The graph doesn't show that at all.
You would like to see the 'status' of the device, e.g. Auto, Off, etc., and the 'until' value, if applicable?
JanvdW wrote: Thursday 23 April 2020 16:00
I was wondering if I can add a line graph that presents the set points for these devices? Has anyone ideas how to do that?
You wish to see the setpoint values displayed as a line in front of the bars?
JanvdW wrote: Thursday 23 April 2020 16:00
It would be nice if you can choose your own colours. In my case I normally use red as an 'alarm' colour, but it's fine to me if no heating is needed
You want the ability to specify your own "below temp", "at temp" and "above temp" colours on the graph block in CONFIG.js?
>>> Please can you confirm I have understood correctly to all 3 feature requests?
Re: Dashticz Graphs - Features, Fixes & Updates
Posted: Sunday 26 April 2020 11:46
by Ewaldharmsen
I am trying to modyfy a popup graph like this:
Code: Select all
blocks[34] = {
  width: 6
}

blocks['graph_34'] = {
    devices: [34],
    datasetColors: ['yellow']
}
The device shows up just fine in my dashboard, but the popup graph is not changed at all. The color is still red. What am I doing wrong?
If I add graph_34 to my colum it is displayed with a yellow color, but I cannot change the popup graph
Re: Dashticz Graphs - Features, Fixes & Updates
Posted: Sunday 26 April 2020 17:27
by clinkadink
You are missing the "popup" parameter in your block, which tells the block which popup config to use.
Code: Select all
blocks[347] = {
  title: 'Consumption',
  flash: 500,
  width: 4,
  popup: 'popup_consumption'
}

blocks['popup_consumption'] = {
  title: 'Energy Consumption Popup',
  devices: [347],
  datasetColors: ['red', 'yellow'],
  debugButton: true,
  graph: 'line',
  legend: {
    'v_347'	: 'Usage',
    'c_347'	: 'Total'
  }
}
Re: Dashticz Graphs - Features, Fixes & Updates
Posted: Sunday 26 April 2020 18:01
by Ewaldharmsen
clinkadink wrote: Sunday 26 April 2020 17:27
You are missing the "popup" parameter in your block, which tells the block which popup config to use.
Code: Select all
blocks[347] = {
  title: 'Consumption',
  flash: 500,
  width: 4,
  popup: 'popup_consumption'
}

blocks['popup_consumption'] = {
  title: 'Energy Consumption Popup',
  devices: [347],
  datasetColors: ['red', 'yellow'],
  debugButton: true,
  graph: 'line',
  legend: {
    'v_347'	: 'Usage',
    'c_347'	: 'Total'
  }
}
Thanks, that works!
I could not find that in the master or beta documentation, did I overlook that?