Re: Multiple sources in one graph
Posted: Sunday 19 January 2020 18:10
Cool, I will update 
Open source Home Automation System
https://forum.domoticz.com/
clinkadink wrote: Sunday 19 January 2020 15:51HansieNL wrote: Sunday 19 January 2020 14:24 If shown last hours or today the lines are red and green, but when showing last month both lines are green.
Do I have to add some extra code?Thanks for your explanation. Working ok now.Code: Select all
blocks['multigraph_354'] = {
	title: 'Buiten- vs Binnentemperatuur',
        devices: [ 354, 437],
        datasetColors: ['red','green'],
        multigraphTypes: ['te'],
        graph: 'line',
        legend: {
                'te1': 'Buiten',
                'te2': 'Binnen',
        }
}
Excellent, great to hear
Code: Select all
config['graph_zoom'] = 1; Code: Select all
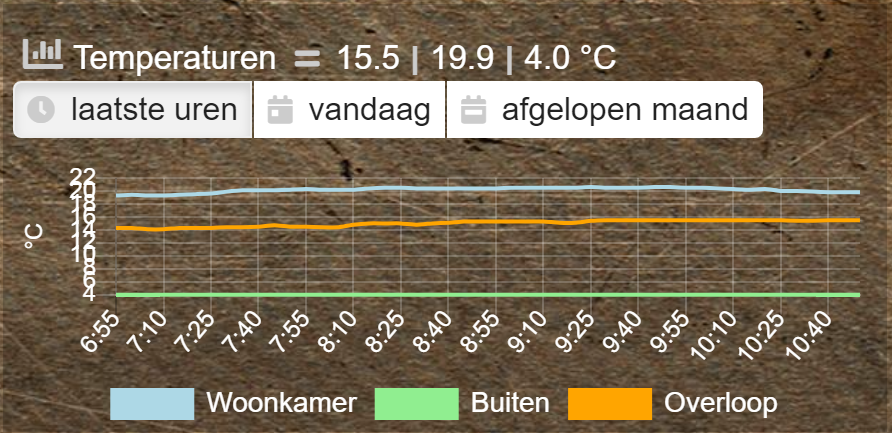
blocks['multigraph_20'] = {
	title: 'Temperaturen',
	devices: [20,25,26],
	datasetColors: ['lightblue','lightgreen','orange'],
	legend: true,
	graph: 'line',
	legend: {
      'te1'		: 'Woonkamer',
	  'te2'		: 'Buiten',
	  'te3'     : 'Overloop'
     }
}
Code: Select all
blocks['multigraph_1'] = {
	title: 'Grid vs Solar',
	devices: [1, 162],
	interval: 1,
	maxTicksLimit: 12,
        datasetColors: [oRed, oGreen],
	/* gradients: [[oGreenDark, oYellow], [oRed, oWhite]],
	gradientHeight: 2.5, */
	buttonsIcon: sGreen,
	pointRadius: 0,
	borderWidth: 3,
	/* lineFill: [true, true], */
	lineTension: 0.4,
	graph: 'line',
	cartesian : 'logarithmic',
	/* cartesian : 'linear', */
	/* maxTicksLimit: 10, */
	reverseTime: false,
	buttonsBorder: 'green',
	buttonsColor: '#green',
	buttonsFill: '#fff',
	buttonsIcon: sGreen,
	buttonsPadX: 10,
	buttonsPadY: 5,
	buttonsMarginX: 25,
	buttonsMarginY: 2,
	buttonsRadius: 10,
	buttonsShadow: oGreen,
	buttonsSize: 12,
	buttonsText: ['NOW', 'TODAY', 'MONTH'],
 	drawOrderLast:  ['v2', 'v1'],
	drawOrderDay:   ['v2', 'v1'],
	drawOrderMonth: ['v1', 'v2', 'c1', 'c2'],
	legend: {
	  'v1'	: 'Grid',
	  'v2'	: 'Solar',
	  'c1'	: 'Solar Cumulative',
	  'c2'	: 'Solar Cumulative'
    }
}

Code: Select all
ActTime	1579588279
AstrTwilightEnd	"19:05"
AstrTwilightStart	"06:31"
CivTwilightEnd	"17:45"
CivTwilightStart	"07:51"
DayLength	"08:40"
NautTwilightEnd	"18:26"
NautTwilightStart	"07:10"
ServerTime	"2020-01-21 07:31:19"
SunAtSouth	"12:48"
Sunrise	"08:28"
Sunset	"17:08"
app_version	"4.11062"
result
0
AddjMulti	1
AddjMulti2	1
AddjValue	0
AddjValue2	0
BatteryLevel	255
CustomImage	0
Data	"17.0"
Description	""
Favorite	1
HardwareID	23
HardwareName	"SVT-thermostaat"
HardwareType	"Smart Virtual Thermostat"
HardwareTypeVal	94
HaveTimeout	false
ID	"00170004"
LastUpdate	"2020-01-21 06:40:00"
Name	"SVT Setpoint Normal"
Notifications	"false"
PlanID	"0"
PlanIDs
0	0
Protected	false
SetPoint	"17.0"
ShowNotifications	true
SignalLevel	"-"
SubType	"SetPoint"
Timers	"false"
Type	"Thermostat"
TypeImg	"override_mini"
Unit	4
Used	1
XOffset	"0"
YOffset	"0"
idx	"941"
status	"OK"
title "Devices"note that the graph has to be blocky' , made out of vertical and horizontal lines, not lines from datapoint to datapoint.clinkadink wrote: Tuesday 21 January 2020 10:35 I do not understand your second point. Please can you explain?
Below shows three of my thermostat devices (Evohome TRVs), each showing their temperature and setpoint. Is this what you are after?renerene wrote: Tuesday 21 January 2020 11:23 note that the graph has to be blocky' , made out of vertical and horizontal lines, not lines from datapoint to datapoint.

Code: Select all
blocks['multigraph_11'] = {
	title: 'Lounge, Kitchen, Hall Thermostats',
	devices: [ 11, 12, 152],
	interval: 2,
	maxTicksLimit: 12,
	datasetColors: [sLightGrey, sRed, sGreen, sGreenDark, sBlue],
	buttonsIcon: sPurple,
	graph: 'line',
	lineTension: 0,
	borderWidth: 2,
	spanGaps: false,
	multigraphTypes: ['te', 'se'],
	buttonsBorder: '#ccc',
	buttonsColor: '#ccc',
	buttonsFill: 'transparent',
	buttonsIcon: sBlue,
	buttonsPadX: 10,
	buttonsPadY: 5,
	buttonsMarginX: 5,
	buttonsMarginY: 2,
	buttonsRadius: 0,
	buttonsShadow: 'rgba(2, 117, 216, 0.2)',
	buttonsSize: 12,
	buttonsText: ['6H', '24H', '1M'],
	legend: {
          'se1': 'Lounge (SP)',
	  'sm1': 'Lounge (SP Min)',
	  'sx1': 'Lounge (SP Max)',
	  'te1': 'Lounge (TE)',
	  'ta1': 'Lounge (TE Avg)',
	  'tm1': 'Lounge (TE Min)',
	  'se2': 'Kitchen (SP)',
	  'sm2': 'Kitchen (SP Min)',
	  'sx2': 'Kitchen (SP Max)',
	  'te2': 'Kitchen (TE)',
	  'ta2': 'Kitchen (TE Avg)',
	  'tm2': 'Kitchen (TE Min)',
	  'se3': 'Hall (SP)',
	  'sm3': 'Hall (SP Min)',
	  'sx3': 'Hall (SP Max)',
          'te3': 'Hall (TE)',
	  'ta3': 'Hall (TE Avg)',
	  'tm3': 'Hall (TE Min)'
	}
} Please try the latest update using the new setting:
Code: Select all
sortDevices: falseCode: Select all
blocks['multigraph_1320'] = {
  devices: [941, 1320, 1321, 1391],
   custom : {
    "8 uur binnen": {
            range: 'day',
            filter: '8 hours',
            data: {
                sp: 'd.se1',
                binnen: 'd.te2',
//              buiten: 'd.te2',
                cv: 'd.te3',
            }
        },
     "24 uur": {
            range: 'day',
            filter: '24 hours',
            data: {
                binnen: 'd.te1',
                buiten: 'd.te2',
                cv: 'd.te3',
                sp: 'd.se4'
            }
        },