Page 4 of 5
Re: v3.2.0 beta
Posted: Thursday 14 November 2019 19:07
by pvklink
@lokonli
It works!
My to_do_styling list is after months from 15 to 1
What to do if the last one is solved....
Re: v3.2.0 beta
Posted: Thursday 14 November 2019 22:28
by Lokonli
Vomera wrote: Thursday 14 November 2019 9:23
After updating to 3.2.0 my script for status displaying the washing machine doesnt work anymore.
It works great in 3.1.0 (still have 3.1.0 version also). I
Custom.js
Code: Select all
// wasmachine
function getChange_7344_1(idx,value,device){

    if(parseFloat(device['Usage'])==1){
      $('div.block_7344_1').addClass('warninggreen').removeClass('warningrood');
	  blocks['7344_1']['icon'] = 'fas fa-check';
	  blocks['7344_1']['title'] = 'Wasmachine klaar en staat nog aan';

   }

   else if(parseFloat(device['Usage'])==0){
      $('div.block_7344_1').removeClass('warninggreen').removeClass('warningrood');
	  blocks['7344_1']['icon'] = 'fas fa-power-off';
	  blocks['7344_1']['title'] = 'Wasmachine uit';
   }

   else {
      $('div.block_7344_1').removeClass('warninggreen').addClass('warningrood');
	  blocks['7344_1']['icon'] = 'fas fa-tshirt';
	  blocks['7344_1']['title'] = 'Wasmachine is bezig';

   }
}
custom.css
Code: Select all
.warninggreen {
	background: rgba(154,205,50,1.0) !important;
    background-clip: padding-box;
}

.warningrood {
	background: rgba(199,44,44,1.0) !important;
	background-clip: padding-box;
}
Cannot find the faillure of the code...
That is indeed a bug

Fixed in most recent beta...
Can you test?
Re: v3.2.0 beta
Posted: Friday 15 November 2019 1:11
by HansieNL
pvklink wrote: Thursday 14 November 2019 19:07
@lokonli
It works!
My to_do_styling list is after months from 15 to 1
What to do if the last one is solved....
Help other people with their Dashticz dashboard!!!
Mine is finished too...
https://www.domoticz.com/forum/viewtop ... 60#p227648
Re: v3.2.0 beta
Posted: Friday 15 November 2019 10:36
by Vomera
Lokonli wrote: Thursday 14 November 2019 22:28
Vomera wrote: Thursday 14 November 2019 9:23
After updating to 3.2.0 my script for status displaying the washing machine doesnt work anymore.
It works great in 3.1.0 (still have 3.1.0 version also). I
Custom.js
Code: Select all
// wasmachine
function getChange_7344_1(idx,value,device){

    if(parseFloat(device['Usage'])==1){
      $('div.block_7344_1').addClass('warninggreen').removeClass('warningrood');
	  blocks['7344_1']['icon'] = 'fas fa-check';
	  blocks['7344_1']['title'] = 'Wasmachine klaar en staat nog aan';

   }

   else if(parseFloat(device['Usage'])==0){
      $('div.block_7344_1').removeClass('warninggreen').removeClass('warningrood');
	  blocks['7344_1']['icon'] = 'fas fa-power-off';
	  blocks['7344_1']['title'] = 'Wasmachine uit';
   }

   else {
      $('div.block_7344_1').removeClass('warninggreen').addClass('warningrood');
	  blocks['7344_1']['icon'] = 'fas fa-tshirt';
	  blocks['7344_1']['title'] = 'Wasmachine is bezig';

   }
}
custom.css
Code: Select all
.warninggreen {
	background: rgba(154,205,50,1.0) !important;
    background-clip: padding-box;
}

.warningrood {
	background: rgba(199,44,44,1.0) !important;
	background-clip: padding-box;
}
Cannot find the faillure of the code...
That is indeed a bug
Fixed in most recent beta...
Can you test?
Yes it works again

thank you! another problem solved
Re: v3.2.0 beta
Posted: Monday 18 November 2019 22:22
by madradrakie
After updating to the new beta my graphs are shown like this. How can i make the bars thicker just like in the previous version?
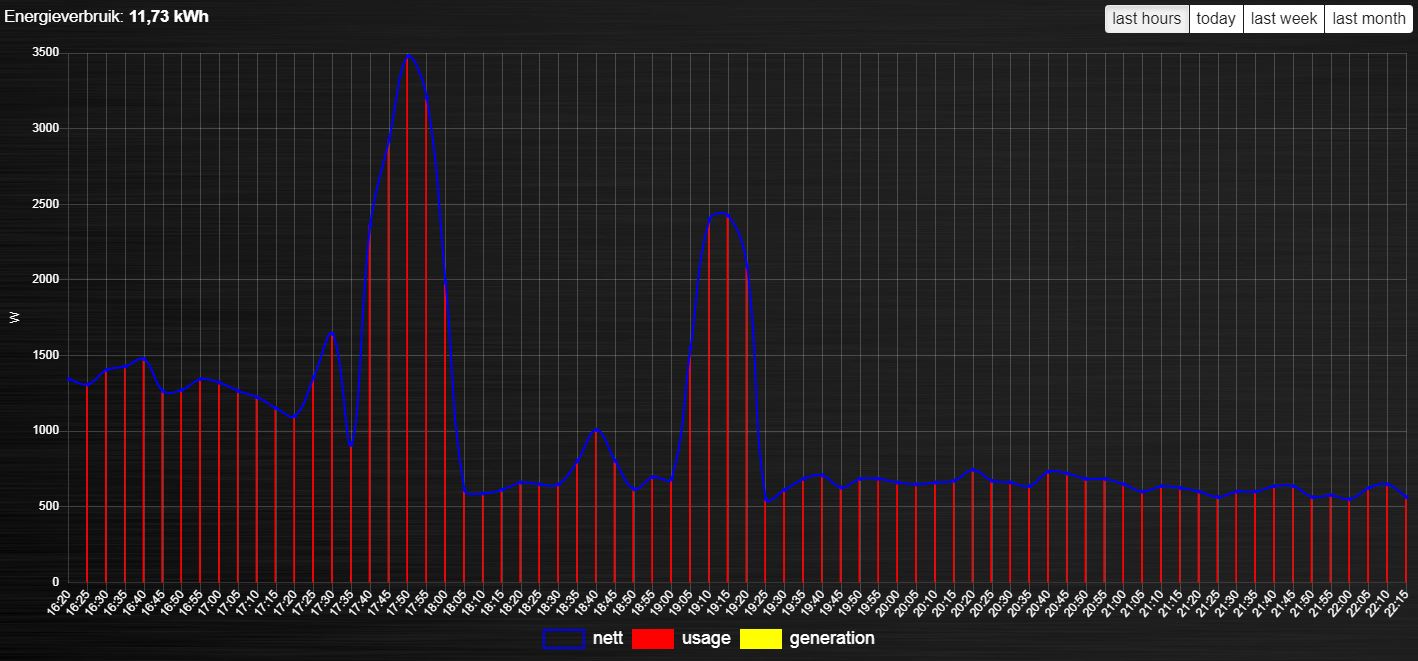
- Knipsel.JPG (150.43 KiB) Viewed 1481 times
This is the code i use at the moment. Thanks for your help
Code: Select all
blocks['graph_76'] = {
	title: 'Energieverbruik',
	graph: ['line','bar','bar'],
	datasetColors:['blue','red','yellow'],
	legend: true,
	displayFormats : {
    		minute: 'kk:mm',
		hour: 'D MMM',
		day: 'll',
      		week: 'ww',
	      	month: 'MMM D',},
	custom :{
        	"last hours": {
	            range: 'day',
        	    filter: '6 hours',
	            data: {
        	        nett: 'd.v+d.v2-d.r1-d.r2',
                	usage: 'd.v+d.v2',
	                generation: '-d.r1-d.r2'
            }
        },
        	"today": {
	            range: 'day',
        	    filter: '10 hours',
	            data: {
        	        nett: 'd.v+d.v2-d.r1-d.r2',
                	usage: 'd.v+d.v2',
	                generation: '-d.r1-d.r2'
            }
        },
        	"last week": {
	            range: 'month',
        	    filter: '1 week',
	            data: {
        	        nett: 'd.v+d.v2-d.r1-d.r2',
                	usage: 'd.v+d.v2',
	                generation: '-d.r1-d.r2'
            }
        },
        	"last month": {
	            range: 'year',
        	    filter: '1 months',
	            data: {
        	        nett: 'd.v+d.v2-d.r1-d.r2',
                	usage: 'd.v+d.v2',
	                generation: '-d.r1-d.r2'
            }
        },
  	}
}
Re: v3.2.0 beta
Posted: Monday 18 November 2019 22:25
by madradrakie
and another question. After updating to the new version two of my buttons (which i use for hyperlinks to another slide) are very big. I can not find the problem.
- Knipsel.JPG (34.09 KiB) Viewed 1480 times
This is the part of the code i always used.
Code: Select all
buttons.p1 = {key: 'Scenes', width:3, icon: 'fas fa-home', title: 'Home',slide:1 }
buttons.p2 = {key: 'Beneden', width:2, btnimage: 'img/favicon/largetile.png', title: 'P.2',slide:2 }
buttons.p3 = {key: 'Boven', width:2, btnimage: 'img/favicon/largetile.png', title: 'P.3',slide:3 }
buttons.p4 = {key: 'Energie', width:3, icon: 'fas fa-bolt', title: 'Power',slide:4 }
buttons.p5 = {key: 'Water', width:3, icon: 'fas fa-shower', title: 'Water',slide:5 }
buttons.p6 = {key: 'Muziek', width:2, btnimage: 'img/favicon/largetile.png', title: 'P.6',slide:6 }
Re: v3.2.0 beta
Posted: Monday 18 November 2019 22:51
by Lokonli
madradrakie wrote: Monday 18 November 2019 22:22
After updating to the new beta my graphs are shown like this. How can i make the bars thicker just like in the previous version?
Knipsel.JPG
This is the code i use at the moment. Thanks for your help
Code: Select all
blocks['graph_76'] = {
	title: 'Energieverbruik',
	graph: ['line','bar','bar'],
	datasetColors:['blue','red','yellow'],
	legend: true,
	displayFormats : {
    		minute: 'kk:mm',
		hour: 'D MMM',
		day: 'll',
      		week: 'ww',
	      	month: 'MMM D',},
	custom :{
        	"last hours": {
	            range: 'day',
        	    filter: '6 hours',
	            data: {
        	        nett: 'd.v+d.v2-d.r1-d.r2',
                	usage: 'd.v+d.v2',
	                generation: '-d.r1-d.r2'
            }
        },
        	"today": {
	            range: 'day',
        	    filter: '10 hours',
	            data: {
        	        nett: 'd.v+d.v2-d.r1-d.r2',
                	usage: 'd.v+d.v2',
	                generation: '-d.r1-d.r2'
            }
        },
        	"last week": {
	            range: 'month',
        	    filter: '1 week',
	            data: {
        	        nett: 'd.v+d.v2-d.r1-d.r2',
                	usage: 'd.v+d.v2',
	                generation: '-d.r1-d.r2'
            }
        },
        	"last month": {
	            range: 'year',
        	    filter: '1 months',
	            data: {
        	        nett: 'd.v+d.v2-d.r1-d.r2',
                	usage: 'd.v+d.v2',
	                generation: '-d.r1-d.r2'
            }
        },
  	}
}
What was your previous version?
Re: v3.2.0 beta
Posted: Monday 18 November 2019 22:58
by Lokonli
madradrakie wrote: Monday 18 November 2019 22:25
and another question. After updating to the new version two of my buttons (which i use for hyperlinks to another slide) are very big. I can not find the problem.
Knipsel.JPG
This is the part of the code i always used.
Code: Select all
buttons.p1 = {key: 'Scenes', width:3, icon: 'fas fa-home', title: 'Home',slide:1 }
buttons.p2 = {key: 'Beneden', width:2, btnimage: 'img/favicon/largetile.png', title: 'P.2',slide:2 }
buttons.p3 = {key: 'Boven', width:2, btnimage: 'img/favicon/largetile.png', title: 'P.3',slide:3 }
buttons.p4 = {key: 'Energie', width:3, icon: 'fas fa-bolt', title: 'Power',slide:4 }
buttons.p5 = {key: 'Water', width:3, icon: 'fas fa-shower', title: 'Water',slide:5 }
buttons.p6 = {key: 'Muziek', width:2, btnimage: 'img/favicon/largetile.png', title: 'P.6',slide:6 }
Which buttons are bigger? What do you mean with very big?
In beta v3.2.0 the default size of button titles was changed. You can change it via custom.css. Probably:
Re: v3.2.0 beta
Posted: Tuesday 19 November 2019 20:57
by madradrakie
Lokonli wrote: Monday 18 November 2019 22:51
madradrakie wrote: Monday 18 November 2019 22:22
After updating to the new beta my graphs are shown like this. How can i make the bars thicker just like in the previous version?
Knipsel.JPG
This is the code i use at the moment. Thanks for your help
Code: Select all
blocks['graph_76'] = {
	title: 'Energieverbruik',
	graph: ['line','bar','bar'],
	datasetColors:['blue','red','yellow'],
	legend: true,
	displayFormats : {
    		minute: 'kk:mm',
		hour: 'D MMM',
		day: 'll',
      		week: 'ww',
	      	month: 'MMM D',},
	custom :{
        	"last hours": {
	            range: 'day',
        	    filter: '6 hours',
	            data: {
        	        nett: 'd.v+d.v2-d.r1-d.r2',
                	usage: 'd.v+d.v2',
	                generation: '-d.r1-d.r2'
            }
        },
        	"today": {
	            range: 'day',
        	    filter: '10 hours',
	            data: {
        	        nett: 'd.v+d.v2-d.r1-d.r2',
                	usage: 'd.v+d.v2',
	                generation: '-d.r1-d.r2'
            }
        },
        	"last week": {
	            range: 'month',
        	    filter: '1 week',
	            data: {
        	        nett: 'd.v+d.v2-d.r1-d.r2',
                	usage: 'd.v+d.v2',
	                generation: '-d.r1-d.r2'
            }
        },
        	"last month": {
	            range: 'year',
        	    filter: '1 months',
	            data: {
        	        nett: 'd.v+d.v2-d.r1-d.r2',
                	usage: 'd.v+d.v2',
	                generation: '-d.r1-d.r2'
            }
        },
  	}
}
What was your previous version?
The previous version was 3.1.2. It looks like the graphs shows a value which is given by Domoticz every 5 minutes. But the x-axes shows a value every minute. In the previous version the graph only showed a value every 5 minutes and that is probably why the bars appeared bigger?
Re: v3.2.0 beta
Posted: Tuesday 19 November 2019 21:53
by madradrakie
Lokonli wrote: Monday 18 November 2019 22:58
madradrakie wrote: Monday 18 November 2019 22:25
and another question. After updating to the new version two of my buttons (which i use for hyperlinks to another slide) are very big. I can not find the problem.
Knipsel.JPG
This is the part of the code i always used.
Code: Select all
buttons.p1 = {key: 'Scenes', width:3, icon: 'fas fa-home', title: 'Home',slide:1 }
buttons.p2 = {key: 'Beneden', width:2, btnimage: 'img/favicon/largetile.png', title: 'P.2',slide:2 }
buttons.p3 = {key: 'Boven', width:2, btnimage: 'img/favicon/largetile.png', title: 'P.3',slide:3 }
buttons.p4 = {key: 'Energie', width:3, icon: 'fas fa-bolt', title: 'Power',slide:4 }
buttons.p5 = {key: 'Water', width:3, icon: 'fas fa-shower', title: 'Water',slide:5 }
buttons.p6 = {key: 'Muziek', width:2, btnimage: 'img/favicon/largetile.png', title: 'P.6',slide:6 }
Which buttons are bigger? What do you mean with very big?
In beta v3.2.0 the default size of button titles was changed. You can change it via custom.css. Probably:
your solution worked but the buttons have a different height than for example my scenes or light buttons (see image). Also the text is shown right from the icon instead of beneath. Is it possible to adjust these things in for example the css file? Do you know how? I have searched the forum but could not find the solution yet.
Re: v3.2.0 beta
Posted: Wednesday 20 November 2019 11:23
by pvklink
With one off the last updates (dont know which) i had to reinstall my zwave devices. My wasmachine_kwh usage device was a type generic and after reinstall type electric. I changed my dzventscode , so far all succesfull..
My js code in dashticz also didnt work. I had to change 1864_1 to 1864 and in my old version i could use 'Usage' ..
This does not work anymore.. i also tried Data and value..
perhaps it has something to to that this type has more than only a numeric value but also Watt in the value?
I could use some help....
Code: Select all
//1864_1 changed to 1864 en Usage changed to Data, value etc.
function getChange_1864(idx,value,device)
{if(parseFloat(device['Usage'])>1)
	{
	blocks['1864']['icon'] = 'fas fa-thermometer-full';
	}
else	{
	blocks['1864']['icon'] = 'fas fa-thermometer-half';
	}
}
data from device
Code: Select all
{
   "ActTime" : 1574244476,
   "AstrTwilightEnd" : "18:46",
   "AstrTwilightStart" : "06:11",
   "CivTwilightEnd" : "17:24",
   "CivTwilightStart" : "07:33",
   "DayLength" : "08:35",
   "NautTwilightEnd" : "18:05",
   "NautTwilightStart" : "06:51",
   "ServerTime" : "2019-11-20 11:07:56",
   "SunAtSouth" : "12:28",
   "Sunrise" : "08:11",
   "Sunset" : "16:46",
   "app_version" : "4.11492",
   "result" : [
      {
         "AddjMulti" : 1.0,
         "AddjMulti2" : 1.0,
         "AddjValue" : 0.0,
         "AddjValue2" : 0.0,
         "BatteryLevel" : 255,
         "CustomImage" : 0,
         "Data" : "25 Watt",
         "Description" : "",
         "Favorite" : 0,
         "HardwareID" : 10,
         "HardwareName" : "zwavepluspvk",
         "HardwareType" : "OpenZWave USB",
         "HardwareTypeVal" : 21,
         "HaveTimeout" : false,
         "ID" : "0000E04",
         "LastUpdate" : "2019-11-20 11:07:16",
         "Name" : "wasmachine_kwh",
         "Notifications" : "false",
         "PlanID" : "0",
         "PlanIDs" : [ 0 ],
         "Protected" : false,
         "ShowNotifications" : true,
         "SignalLevel" : "-",
         "SubType" : "Electric",
         "Timers" : "false",
         "Type" : "Usage",
         "TypeImg" : "current",
         "Unit" : 2,
         "Used" : 1,
         "XOffset" : "0",
         "YOffset" : "0",
         "idx" : "1864"
      }
   ],
   "status" : "OK",
   "title" : "Devices"
}
Re: v3.2.0 beta
Posted: Wednesday 20 November 2019 12:49
by pvklink
ha, i am proud..
Solved it myself........but i dont know why this one works.. ! o.a changed to another function getStatus instead off GetChange
function getStatus_1864(idx,value,device)
{
if (parseFloat(device.Data) >1)
{
blocks['1864']['title'] = 'Wasmachine Aan';
blocks['1864']['icon'] = 'fas fa-thermometer-full';
}
else {
blocks['1864']['title'] = 'Wasmachine Uit';
blocks['1864']['icon'] = 'fas fa-thermometer-half';
}
}
Re: v3.2.0 beta
Posted: Wednesday 20 November 2019 15:39
by Lokonli
Well done!

I guess it's the same bug as reported by Vomera.
See
https://www.domoticz.com/forum/viewtopi ... 03#p228403
It's solved in the latest beta.
Re: v3.2.0 beta
Posted: Wednesday 20 November 2019 16:36
by pvklink
i have v3.2.0
and after updating to a new beta, do i have to use
getStatus or the orignal GetChange (i use it when powerconsumption changes above or below a value)
I guess this has nothing to do that i must use Data instead of Usage property ? (think that is zwave related)..
Re: v3.2.0 beta
Posted: Wednesday 20 November 2019 17:54
by Lokonli
pvklink wrote: Wednesday 20 November 2019 16:36
i have v3.2.0
and after updating to a new beta, do i have to use
getStatus or the orignal GetChange (i use it when powerconsumption changes above or below a value)
I guess this has nothing to do that i must use Data instead of Usage property ? (think that is zwave related)..
I did not update the version number yet. I'll collect a few changes first.
Both should work. GetChange only gets called if the device was updated.
Whether you have to use Data or Usage depends indeed on the device. You can check the raw json device info from Domoticz to look for the fieldname you have to use.
Re: v3.2.0 beta
Posted: Wednesday 20 November 2019 18:17
by pvklink
Ok, no problem and no hurry. When there is a new version, i will test again...with both functions...
When does getStatus_1864 activates, with a screen refresh?
Re: v3.2.0 beta
Posted: Thursday 21 November 2019 10:12
by Dave47
Hallo is it possible tu use speak in blocks @ the moment?
How do i set?
Must i also change settings in config parameter?
Re: v3.2.0 beta
Posted: Thursday 21 November 2019 15:38
by HansieNL
Dave47 wrote: Thursday 21 November 2019 10:12
Hallo is it possible tu use speak in blocks @ the moment?
How do i set?
Must i also change settings in config parameter?
I don’t use speak. But I don’t see an issue with speak.
All block parameters you can find here:
https://dashticz.readthedocs.io/en/bet ... parameters
And you have to set the speak_lang in config.
Re: v3.2.0 beta
Posted: Friday 22 November 2019 15:04
by Dave47
speak_lang in config. did not work if device is not in the same language?
I set device on nl_NL, but the device is in Englisch.
Re: v3.2.0 beta
Posted: Friday 22 November 2019 22:16
by Lokonli
madradrakie wrote: Tuesday 19 November 2019 20:57
Lokonli wrote: Monday 18 November 2019 22:51
madradrakie wrote: Monday 18 November 2019 22:22
After updating to the new beta my graphs are shown like this. How can i make the bars thicker just like in the previous version?
Knipsel.JPG
This is the code i use at the moment. Thanks for your help
Code: Select all
blocks['graph_76'] = {
	title: 'Energieverbruik',
	graph: ['line','bar','bar'],
	datasetColors:['blue','red','yellow'],
	legend: true,
	displayFormats : {
    		minute: 'kk:mm',
		hour: 'D MMM',
		day: 'll',
      		week: 'ww',
	      	month: 'MMM D',},
	custom :{
        	"last hours": {
	            range: 'day',
        	    filter: '6 hours',
	            data: {
        	        nett: 'd.v+d.v2-d.r1-d.r2',
                	usage: 'd.v+d.v2',
	                generation: '-d.r1-d.r2'
            }
        },
        	"today": {
	            range: 'day',
        	    filter: '10 hours',
	            data: {
        	        nett: 'd.v+d.v2-d.r1-d.r2',
                	usage: 'd.v+d.v2',
	                generation: '-d.r1-d.r2'
            }
        },
        	"last week": {
	            range: 'month',
        	    filter: '1 week',
	            data: {
        	        nett: 'd.v+d.v2-d.r1-d.r2',
                	usage: 'd.v+d.v2',
	                generation: '-d.r1-d.r2'
            }
        },
        	"last month": {
	            range: 'year',
        	    filter: '1 months',
	            data: {
        	        nett: 'd.v+d.v2-d.r1-d.r2',
                	usage: 'd.v+d.v2',
	                generation: '-d.r1-d.r2'
            }
        },
  	}
}
What was your previous version?
The previous version was 3.1.2. It looks like the graphs shows a value which is given by Domoticz every 5 minutes. But the x-axes shows a value every minute. In the previous version the graph only showed a value every 5 minutes and that is probably why the bars appeared bigger?
I think that is the reason indeed. It might be a side effect of the latest version of the chart.js module that is being used.
You can modify the x-axis behavior by adding the following to the block definition:
Code: Select all
    options: {
        scales: {
            xAxes: [{
                    distribution: 'series'
            }]
        },
    }
Probably I'll will make this default in the next beta release.