Page 2 of 5
Re: Dashticz - Function - Graphs
Posted: Saturday 28 October 2017 23:31
by askmurphy
Thanks!!
Re: Dashticz - Function - Graphs issue
Posted: Saturday 28 October 2017 23:46
by askmurphy
I have a litte problem with the graphs, this is inside my config:
https://mega.nz/#!ClkC1CpY!m2O-XP_TdQ24 ... V3MDRsrR3c
blocks[23] = {}
blocks[23]['width'] = 6;
blocks[23]['title'] = 'Zonnepanelen'
blocks[23]['hide_data'] = false;
blocks[23]['hide_lastupdate'] = true;
blocks[23]['icon'] = 'fa-circle';
blocks[23]['protected'] = false;
columns[1] = {}
columns[1]['blocks'] = ['graph_23']
columns[1]['width'] = 8;
columns[2] = {}
columns[2]['blocks'] = ['23_2','23_3',3,4]
columns[2]['width'] = 4;
If I click on the button 'afgelopen maand' I see on top still the amount of kWh what's produced in one day: 1.320kWh instead of
the produced energy of the month. How can this be fixed ?
We have a SolarEdge API..
Re: Dashticz - Function - Graphs
Posted: Sunday 05 November 2017 17:30
by PieterS
Build several graphs. Both display information about last week instead of today when I press the button Vandaag. Button last hours gives me a to short view of two hours. Last week is not what i want.

More users with same problem? Or is this configurationerror? Any solution?
Re: Dashticz - Function - Graphs
Posted: Saturday 02 December 2017 21:51
by Zoekm
dlefol wrote: Saturday 28 October 2017 20:09
Hello,
You can use the option
Code: Select all
config['standard_graph'] = 'hours';
to set the default graph to hours, days or month.
Hope this helps
Is there an option to not only set 'standard_graph' with this but also a different setting to a specific graph? So e.g. all graphs to 'month' except for only 1 that is set to 'day'?
Re: Dashticz - Function - Graphs
Posted: Monday 11 December 2017 20:18
by GuidoP18
Is there a way to delete the buttons 'last hours, today, last month'?
Re: Dashticz - Function - Graphs
Posted: Wednesday 13 December 2017 15:32
by robgeerts
In graphs.js you can change:
Code: Select all
var buttons = createButtons(idx, title, label, range, current, sensor, popup);
TO:
Theres no setting for this (yet) ..
Re: Dashticz - Function - Graphs
Posted: Thursday 14 December 2017 12:49
by GuidoP18
Thanks Rob,
But i dit not find
Code: Select all
var buttons = createButtons(idx, title, label, range, current, sensor, popup);
and i'm new to programing so i don't want to mes things up.
Re: Dashticz - Function - Graphs
Posted: Saturday 13 January 2018 21:13
by maceddy
pmalvino wrote: Thursday 13 July 2017 23:02
hello Rob. It's possible to do the selection of two values [idx_1] or [idx_2], like we do on the blocks.
I don't know if you remember , i made a request for this some time ago. Thank you
Hello. I would like this too. I want to have a graph for temperature only, without Humidity.
Aside from this, I would like to know if it is possible to have custom graph view per graph.
I would like to have the rain by month, but temperature by day... For example.. (without clicking offcourse)
Re: Dashticz - Function - Graphs
Posted: Sunday 14 January 2018 11:16
by goshi0
Hello.
Is there any way to make a pop-up with graph on touch a sensor like a temperature or humidity? Beacouse in the wiki hints it's possible but I didn't find how
Re: Dashticz - Function - Graphs
Posted: Monday 15 January 2018 6:52
by tontze
Hi, i just noticed that my outdoor temperature graph is not working. Other are working. Cant push the button at all. It is sensor with humidity and temperature. This works in domoticz. its 433mhz (RFlink) device.
Re: Dashticz - Function - Graphs
Posted: Wednesday 17 January 2018 20:47
by maceddy
GuidoP18 wrote: Monday 11 December 2017 20:18
Is there a way to delete the buttons 'last hours, today, last month'?
I added this line to the custom css..
Not a very neat option, but for me it does the trick...
- Spoiler: show
-
.btn-default {
visibility:hidden; /* aangepast om knoppen in regengrafiek te verbergen */
}
Re: Dashticz - Function - Graphs
Posted: Wednesday 24 January 2018 3:43
by tlkg
Just starting with Dashticz and everything is working pretty good except I can't get any of my devices that create data (i.e. temp, humidity, voltage) to display a graph. The buttons/blocks are created and display the correct data but they are not active buttons. When I mouse over them, the cursor never changes and/or the background doesn't change. These all work fine in Domoticz and when doing a json query the device IDX, all of the data is displayed. (
http://192.168.1.35:6115/json.htm?type= ... &range=day)
{
"result" : [
{
"d" : "2018-01-22 11:30",
"v" : "119.601"
},
{
"d" : "2018-01-22 11:35",
"v" : "120.350"
},
{
"d" : "2018-01-22 11:40",
"v" : "120.850"
},
{
"d" : "2018-01-22 11:45",
"v" : "119.808"
}
],
"status" : "OK",
"title" : "Graph counter day"
}
Other devices like light bulbs and on/off switches work fine as well.
Reading the Wiki seems to imply that the graphing is setup automatically and should not require any coding to get it to work.
Is there something I need to add to CONFIG.js or other file to get these devices to display graphs?
Thanks for any help.
UPDATE Edit:
While the buttons still do not work, I have been able to create static graphs using the graphs_IDX. I was having problems using this method with my temp+Humidity sensor (only hum was being graphed) until I replaced the graphs.js with the latest Beta version. Now all the static graphs are working great. There are a bunch of other modules, that are newer, that are probably addressing other issues. I did replace the blocks.js with the latest Beta, but just got the white screen, so assuming there are other new dependencies in other modules that I didn't replace, so will wait until the Beta is available/released
Thx
Re: Dashticz - Function - Graphs
Posted: Saturday 27 January 2018 17:33
by goshi0
tlkg wrote: Wednesday 24 January 2018 3:43
Just starting with Dashticz and everything is working pretty good except I can't get any of my devices that create data (i.e. temp, humidity, voltage) to display a graph. The buttons/blocks are created and display the correct data but they are not active buttons. When I mouse over them, the cursor never changes and/or the background doesn't change. These all work fine in Domoticz and when doing a json query the device IDX, all of the data is displayed. (
http://192.168.1.35:6115/json.htm?type= ... &range=day)
{
"result" : [
{
"d" : "2018-01-22 11:30",
"v" : "119.601"
},
{
"d" : "2018-01-22 11:35",
"v" : "120.350"
},
{
"d" : "2018-01-22 11:40",
"v" : "120.850"
},
{
"d" : "2018-01-22 11:45",
"v" : "119.808"
}
],
"status" : "OK",
"title" : "Graph counter day"
}
Other devices like light bulbs and on/off switches work fine as well.
Reading the Wiki seems to imply that the graphing is setup automatically and should not require any coding to get it to work.
Is there something I need to add to CONFIG.js or other file to get these devices to display graphs?
Thanks for any help.
Me neither, same as you.
Could not load graph message
Posted: Monday 29 January 2018 8:26
by whatisk
Whenever I click on a device that also can display a graph, I get the message <domoticz ip>:<domoticz port> says: Could not load graph!
Have I missed a configuration somewhere?
The graph displays fine in the standard Domoticz dashboard.
I am running the latest Beta Dashticz
Also, is there a way to change the number format/separator in Dashticz? Ie: have a comma as the thousand separator and a dot as the decimal point.
Re: Could not load graph message
Posted: Friday 09 February 2018 23:07
by whatisk
whatisk wrote: Monday 29 January 2018 8:26
Whenever I click on a device that also can display a graph, I get the message <domoticz ip>:<domoticz port> says: Could not load graph!
Found out what the issue was.
If I removed config['standard_graph'] = 'today'; from my CONFIG.js then graphs load without issue.
Correct option is 'day' not 'today'
Re: Dashticz - Function - Graphs
Posted: Tuesday 27 February 2018 10:09
by 10us
Is it possible to select how many points you want in a graph?
Because for the solar panels i have a point every hour and for the p1 energy usage every 5 min?
And both i like to change solar more points and p1 energie usage less point for a smoother graph.
Anyone who have done this? I would like to have a smooth graphs (day view).
Re: Dashticz - Function - Graphs
Posted: Thursday 05 April 2018 19:45
by javed222pi
Hi all,
I’m try to insert an CO2 (air quality) graph, in my dashticz dashboard, but I cant …
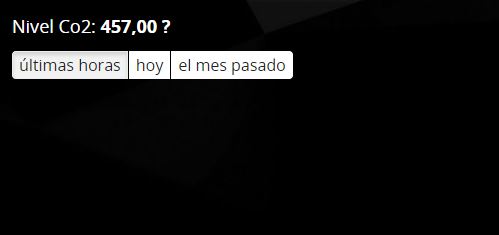
- Captura.JPG (15.43 KiB) Viewed 5526 times
i can see the block data, but the graph not show nothing
How I must to do? I must to edit graphs.js ? but how??
Please help
Thanks
Re: Dashticz - Function - Graphs
Posted: Tuesday 24 April 2018 23:02
by robgeerts
javed222pi wrote: Thursday 05 April 2018 19:45
Hi all,
I’m try to insert an CO2 (air quality) graph, in my dashticz dashboard, but I cant …
Captura.JPG
i can see the block data, but the graph not show nothing
How I must to do? I must to edit graphs.js ? but how??
Please help
Thanks
Could you send me the output of this device from:
http://domoticz_url/json.htm?type=devices&plan=0&filter=all&used=true&order=Name
Re: Dashticz - Function - Graphs
Posted: Wednesday 25 April 2018 23:27
by javed222pi
Hi robgeerts!! Thank you for your answer!
You need this ?:
{
"AddjMulti" : 1.0,
"AddjMulti2" : 1.0,
"AddjValue" : 0.0,
"AddjValue2" : 0.0,
"BatteryLevel" : 255,
"CustomImage" : 0,
"Data" : "432 ppm",
"Description" : "",
"Favorite" : 0,
"HardwareID" : 10,
"HardwareName" : "Netatmo 15R",
"HardwareType" : "Netatmo",
"HardwareTypeVal" : 54,
"HaveTimeout" : false,
"ID" : "0075",
"LastUpdate" : "2018-04-25 18:15:16",
"Name" : "NA Indoor",
"Notifications" : "false",
"PlanID" : "4",
"PlanIDs" : [ 4 ],
"Protected" : false,
"Quality" : "Excellent",
"ShowNotifications" : true,
"SignalLevel" : "-",
"SubType" : "Voltcraft CO-20",
"Timers" : "false",
"Type" : "Air Quality",
"TypeImg" : "air",
"Unit" : 19,
"Used" : 1,
"XOffset" : "432",
"YOffset" : "860",
"idx" : "133"
},
Re: Dashticz - Function - Graphs
Posted: Wednesday 02 May 2018 16:28
by robgeerts
Yes i did, will check this out asap!