I have updated the graph code. Please have a go with the latest update (as of 8.28pm UK time). Fingers cross that solves itSjonnie2017 wrote: Monday 17 February 2020 19:24 I am certain you will! Somehow I expect to have to update to the latest beta somewhere in the near future
Multiple sources in one graph
Moderators: leecollings, htilburgs, robgeerts
- clinkadink
- Posts: 417
- Joined: Tuesday 31 December 2019 1:15
- Target OS: Linux
- Domoticz version: 2020.2
- Location: Swindon, UK
- Contact:
Re: Multiple sources in one graph
"UI is the saddle, the stirrups, & the reins. UX is the feeling you get being able to ride the horse."
- Sjonnie2017
- Posts: 372
- Joined: Wednesday 02 August 2017 19:43
- Target OS: Linux
- Domoticz version: Latest ß
- Location: The Netherlands
- Contact:
Re: Multiple sources in one graph
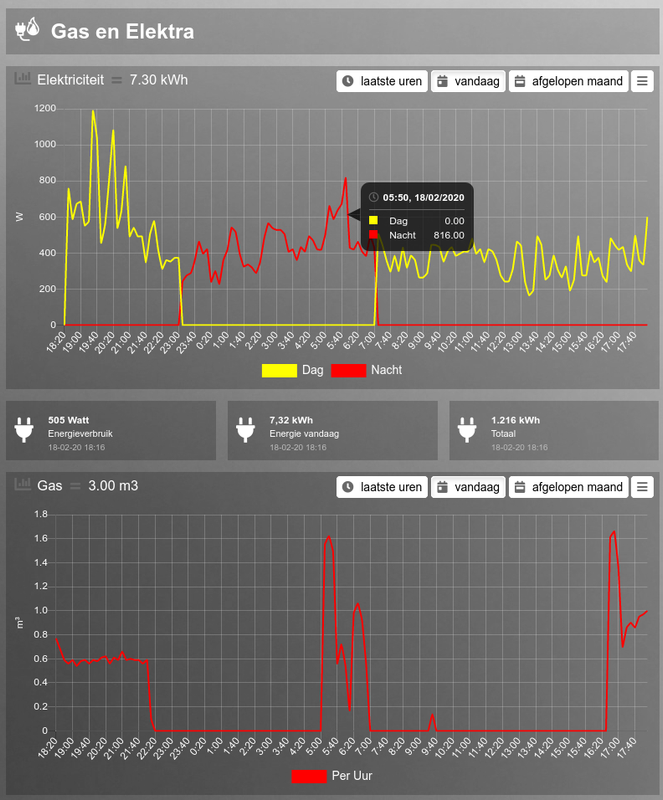
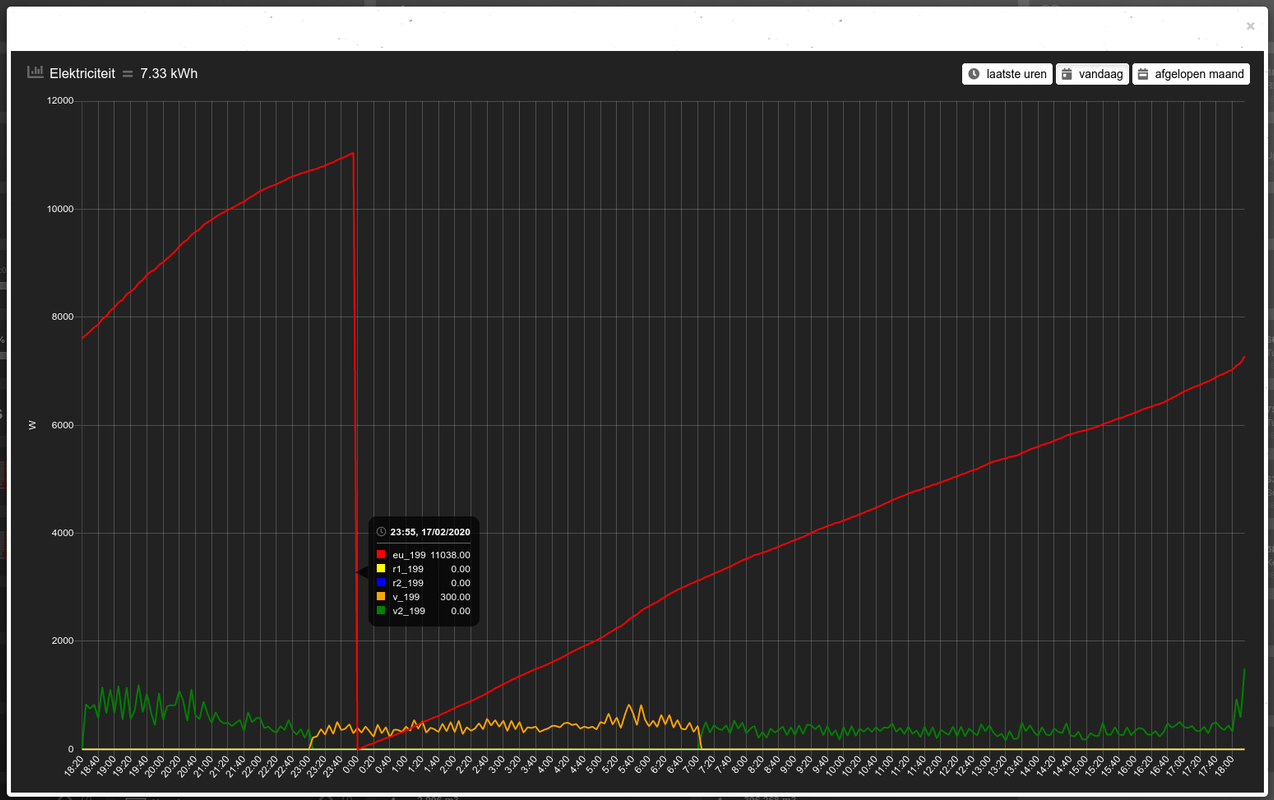
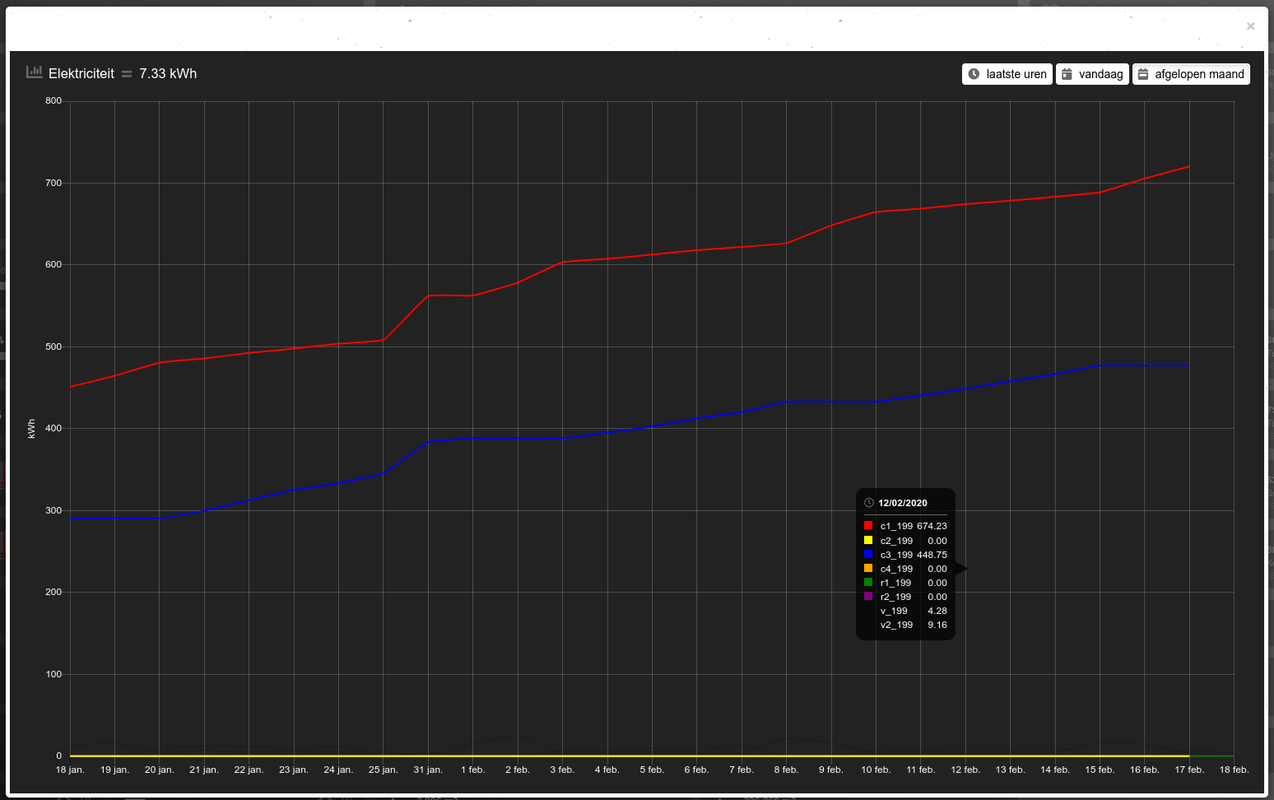
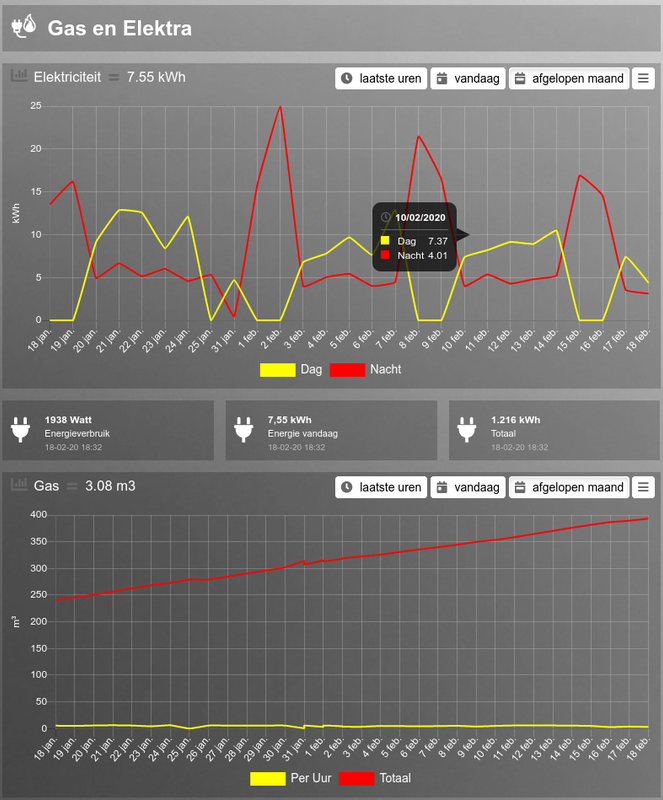
Updated and with unchanged settings in my config.js I get these results:
Dashboard graphs first load:
Popup graphs electricity first load:
Popup graph electricity last month
Popup graph electricity today:
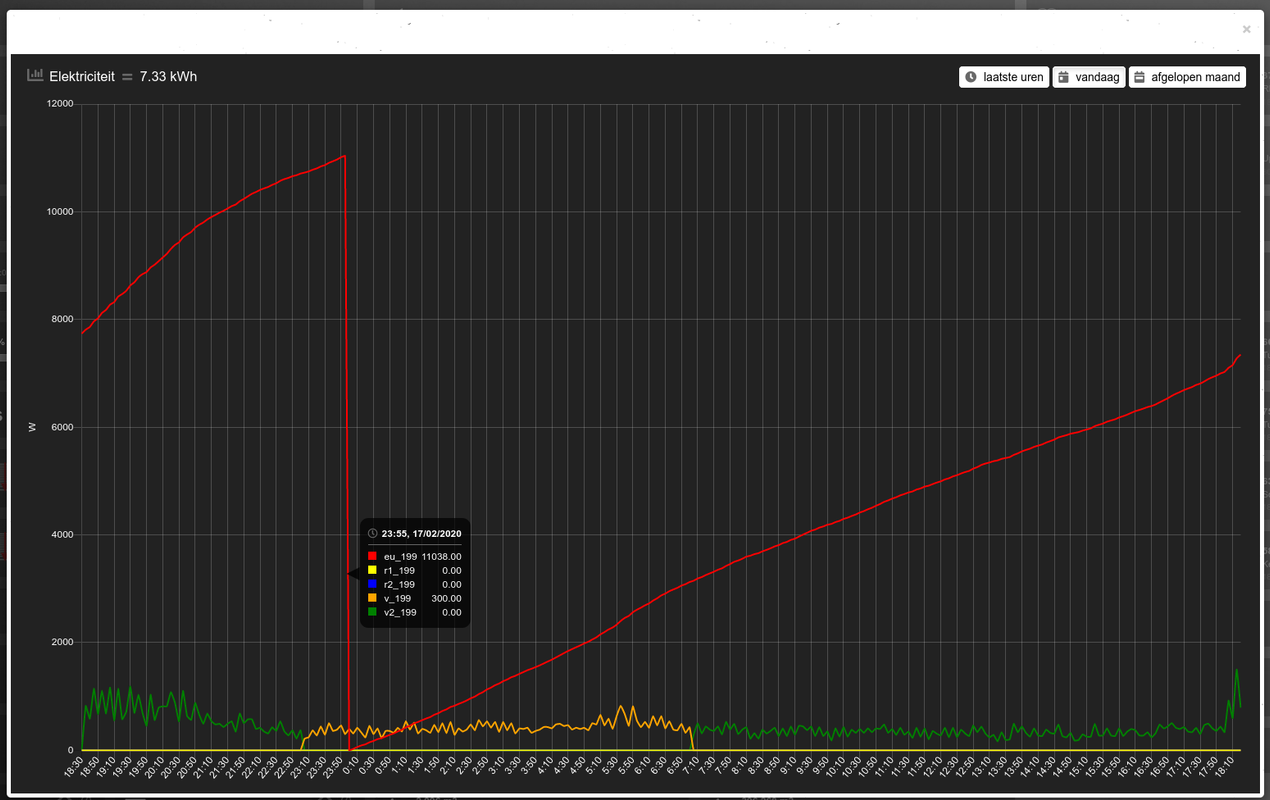
Popup graph electricity last hours:
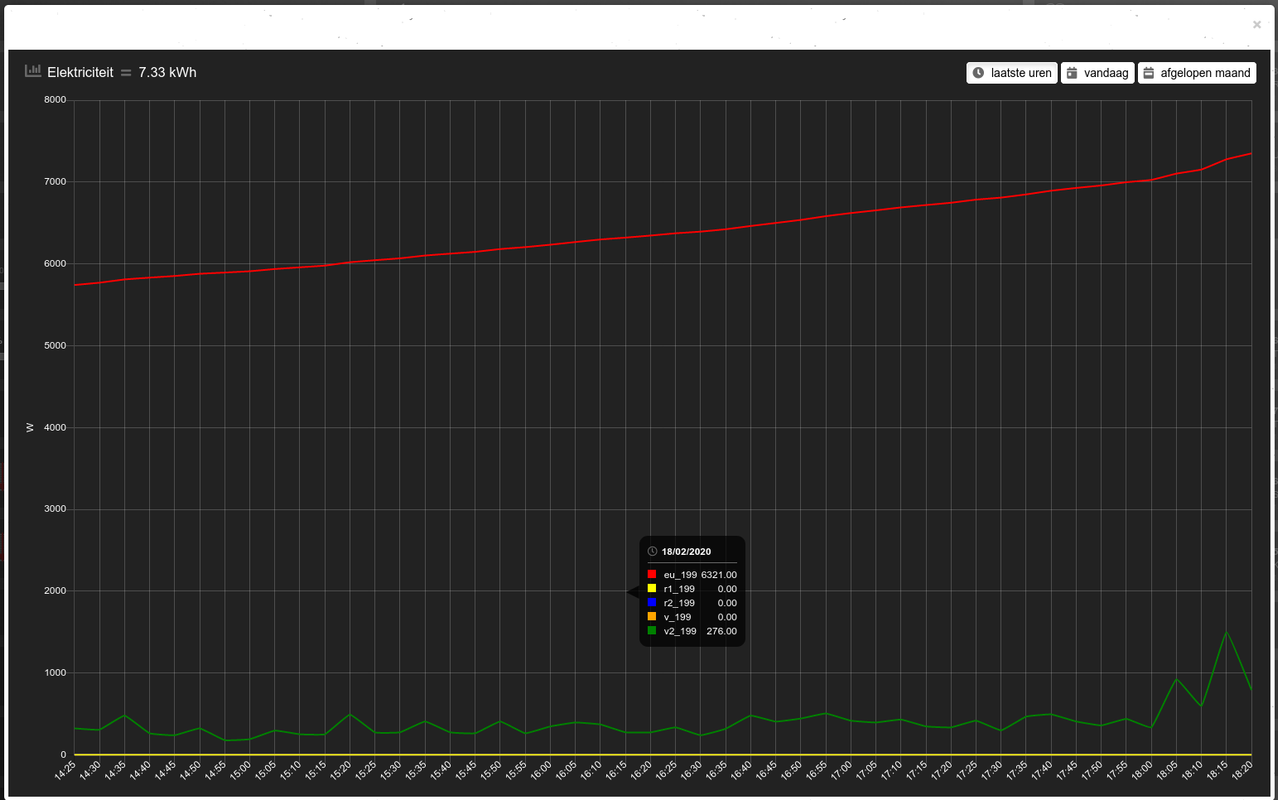
The UoM works like a charm
Only one bug (tool tips) left to squat
Changed my config.js with the following:
all other settings unchanged


Greetz,
Sjonnie
Dashboard graphs first load:

Popup graphs electricity first load:

Popup graph electricity last month

Popup graph electricity today:

Popup graph electricity last hours:

The UoM works like a charm
Only one bug (tool tips) left to squat
Changed my config.js with the following:
Code: Select all
config['standard_graph'] = 'month';
Clinkadink for president!
Greetz,
Sjonnie
ConBee II - TRÅDFRI lights + switches, loads of ChingLing dimmers and switches, Heiman and Xiaomi sensors
SolarEdge SE4000H (with active modbus_tcp)
YouLess Energy meter
Shelly 2.5 in roller shutter mode
SolarEdge SE4000H (with active modbus_tcp)
YouLess Energy meter
Shelly 2.5 in roller shutter mode
- clinkadink
- Posts: 417
- Joined: Tuesday 31 December 2019 1:15
- Target OS: Linux
- Domoticz version: 2020.2
- Location: Swindon, UK
- Contact:
Re: Multiple sources in one graph
Excellent news. Finally, I can sleep at night.
What is the issue with the tooltips (old or new) exactly?
What is the issue with the tooltips (old or new) exactly?
"UI is the saddle, the stirrups, & the reins. UX is the feeling you get being able to ride the horse."
- Sjonnie2017
- Posts: 372
- Joined: Wednesday 02 August 2017 19:43
- Target OS: Linux
- Domoticz version: Latest ß
- Location: The Netherlands
- Contact:
Re: Multiple sources in one graph
In the popup graphs I would really like to see "Dag and "Nacht" instead of v_199 and v2_199. I think that will represent a major challenge but you have built yourself a reputation over here 
Sweet dreams mister President
Greetz,
Sjonnie
Sweet dreams mister President
Greetz,
Sjonnie
ConBee II - TRÅDFRI lights + switches, loads of ChingLing dimmers and switches, Heiman and Xiaomi sensors
SolarEdge SE4000H (with active modbus_tcp)
YouLess Energy meter
Shelly 2.5 in roller shutter mode
SolarEdge SE4000H (with active modbus_tcp)
YouLess Energy meter
Shelly 2.5 in roller shutter mode
- clinkadink
- Posts: 417
- Joined: Tuesday 31 December 2019 1:15
- Target OS: Linux
- Domoticz version: 2020.2
- Location: Swindon, UK
- Contact:
Re: Multiple sources in one graph
Yes, that is a challenge, as without a block defined for popups (where there isn't, as they are all dynamically generated), the popup wouldn't know that "v_199" and "v2_199" is "Dag and "Nacht". Even the device, idx 199, doesn't know thatSjonnie2017 wrote: Tuesday 18 February 2020 18:54 In the popup graphs I would really like to see "Dag and "Nacht" instead of v_199 and v2_199. I think that will represent a major challenge but you have built yourself a reputation over here
I will have a think ... but don't hold your breath
"UI is the saddle, the stirrups, & the reins. UX is the feeling you get being able to ride the horse."
- Sjonnie2017
- Posts: 372
- Joined: Wednesday 02 August 2017 19:43
- Target OS: Linux
- Domoticz version: Latest ß
- Location: The Netherlands
- Contact:
Re: Multiple sources in one graph
I vaguely remember you telling me that the popup graphs are a Domoticz feature and is not handled by Dashticz. So I can't think of any other solution than to "ignore" the Domoticz code and write a popup graph module for Dashticz. Talking about a challenge  I can imagine there are more important issues to consider than tool tips on the popup graphs.
Not holding my breath but curious if you can come up with a brilliant idea how to tackle this
Greetz,
Sjonnie
Not holding my breath but curious if you can come up with a brilliant idea how to tackle this
Greetz,
Sjonnie
ConBee II - TRÅDFRI lights + switches, loads of ChingLing dimmers and switches, Heiman and Xiaomi sensors
SolarEdge SE4000H (with active modbus_tcp)
YouLess Energy meter
Shelly 2.5 in roller shutter mode
SolarEdge SE4000H (with active modbus_tcp)
YouLess Energy meter
Shelly 2.5 in roller shutter mode
- clinkadink
- Posts: 417
- Joined: Tuesday 31 December 2019 1:15
- Target OS: Linux
- Domoticz version: 2020.2
- Location: Swindon, UK
- Contact:
 Re: Multiple sources in one graph
No, tooltips (standard and the recently added HTML version) are Dashticz code. I have will have to give this some thought.Sjonnie2017 wrote: Tuesday 18 February 2020 19:19 I vaguely remember you telling me that the popup graphs are a Domoticz feature and is not handled by Dashticz. So I can't think of any other solution than to "ignore" the Domoticz code and write a popup graph module for Dashticz.
"UI is the saddle, the stirrups, & the reins. UX is the feeling you get being able to ride the horse."
- clinkadink
- Posts: 417
- Joined: Tuesday 31 December 2019 1:15
- Target OS: Linux
- Domoticz version: 2020.2
- Location: Swindon, UK
- Contact:
Re: Multiple sources in one graph
Is there any demand for Pie graphs in Dashticz? Obviously, we have line and bar graphs - but do we need pies too? They are good at comparing values between data. But I have yet to decide if there is need for it in Dashticz.
I had a play last night and thought I'd post an early draft

I had a play last night and thought I'd post an early draft

"UI is the saddle, the stirrups, & the reins. UX is the feeling you get being able to ride the horse."
- Sjonnie2017
- Posts: 372
- Joined: Wednesday 02 August 2017 19:43
- Target OS: Linux
- Domoticz version: Latest ß
- Location: The Netherlands
- Contact:
Re: Multiple sources in one graph
I can't think of a use case that would benefit from it in my scenario. Only thing I can think of is a pie for power consumption where you can see the difference between what you use and what you generate. But I personally would show that in a line/bar graph combination as show in the docs.
I am sure there are plenty of people that can think of other use cases in which the pie would be most welcome (just not me )
)
Greetz,
Sjonnie
I am sure there are plenty of people that can think of other use cases in which the pie would be most welcome (just not me
Greetz,
Sjonnie
ConBee II - TRÅDFRI lights + switches, loads of ChingLing dimmers and switches, Heiman and Xiaomi sensors
SolarEdge SE4000H (with active modbus_tcp)
YouLess Energy meter
Shelly 2.5 in roller shutter mode
SolarEdge SE4000H (with active modbus_tcp)
YouLess Energy meter
Shelly 2.5 in roller shutter mode
- clinkadink
- Posts: 417
- Joined: Tuesday 31 December 2019 1:15
- Target OS: Linux
- Domoticz version: 2020.2
- Location: Swindon, UK
- Contact:
Re: Multiple sources in one graph
I tend to agree. I am sure there maybe an 'edge case', but its not a 'must have' feature. Good to know it can be done if needed, I guessSjonnie2017 wrote: Thursday 20 February 2020 17:58 I can't think of a use case that would benefit from it in my scenario. Only thing I can think of is a pie for power consumption where you can see the difference between what you use and what you generate. But I personally would show that in a line/bar graph combination as show in the docs.
"UI is the saddle, the stirrups, & the reins. UX is the feeling you get being able to ride the horse."
- clinkadink
- Posts: 417
- Joined: Tuesday 31 December 2019 1:15
- Target OS: Linux
- Domoticz version: 2020.2
- Location: Swindon, UK
- Contact:
Re: Multiple sources in one graph
This feature is now available in the latest beta.Sjonnie2017 wrote: Tuesday 18 February 2020 18:54 In the popup graphs I would really like to see "Dag and "Nacht" instead of v_199 and v2_199.
Before:

After:

For the above example, this is added to custom.css:
Code: Select all
.popup_v_258 {
	visibility: collapse;
}
.popup_v_258:after {
	content: 'Usage';
	float: left;
	margin-right: -25px;
	visibility: visible;
}Also applied a fix for single devices with multi-data, this is now displayed correctly in graph header, e.g. Device.Type "Wind" is shown below:

"UI is the saddle, the stirrups, & the reins. UX is the feeling you get being able to ride the horse."
- Sjonnie2017
- Posts: 372
- Joined: Wednesday 02 August 2017 19:43
- Target OS: Linux
- Domoticz version: Latest ß
- Location: The Netherlands
- Contact:
Re: Multiple sources in one graph
Don't hold your breath you said! Admittingly I can't hold my breath for a day or two but needless to say you are again very fast providing a solution 
As your (currently) only crash test dummy I upgraded to the latest beta and applied the changes to the custom.css to test if all is working as you designed.
The custom.css code:
The picture that go along with it:
Dashboard electricity:
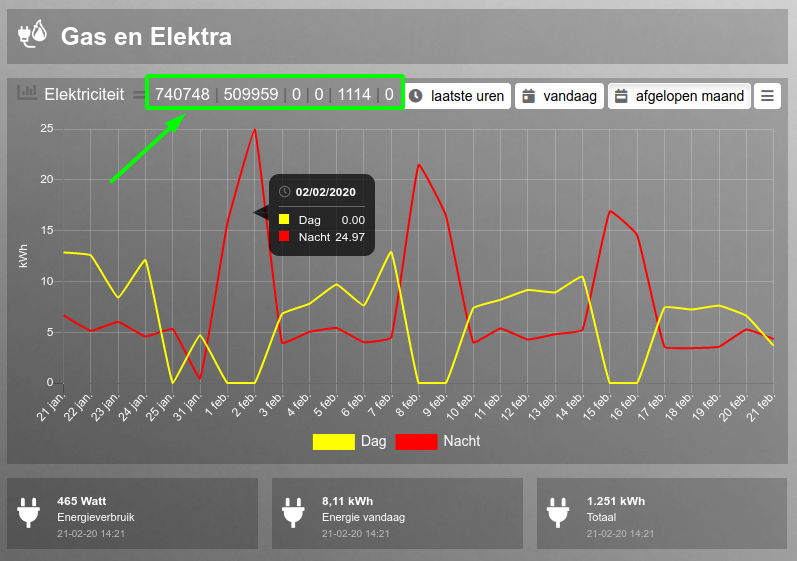
A bit too much info in the header here and the UoM is shown in Watt instead of kilowatt.
Popup electricity:
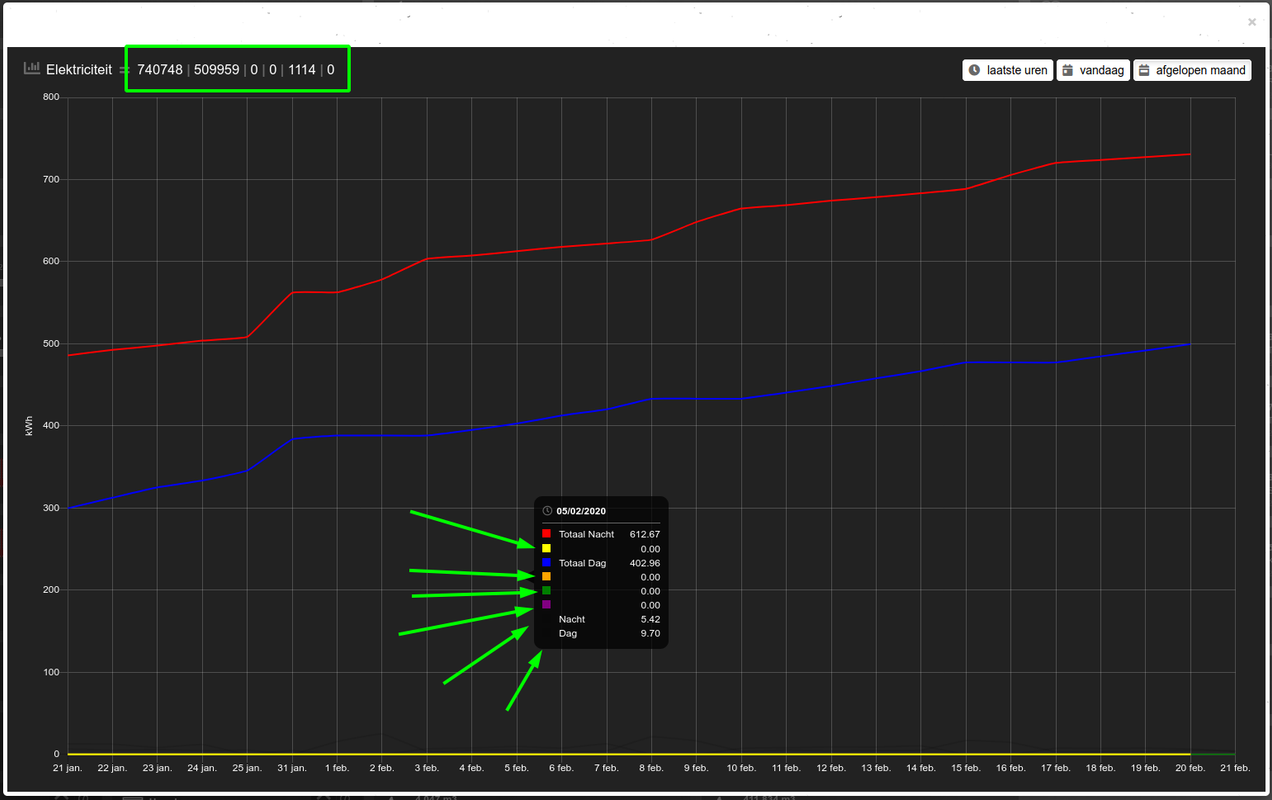
Also here too much info in the header and I would like to suppress the values I don't use. I have tried:
and but that didn't hide the unwanted values.
Just another sample:
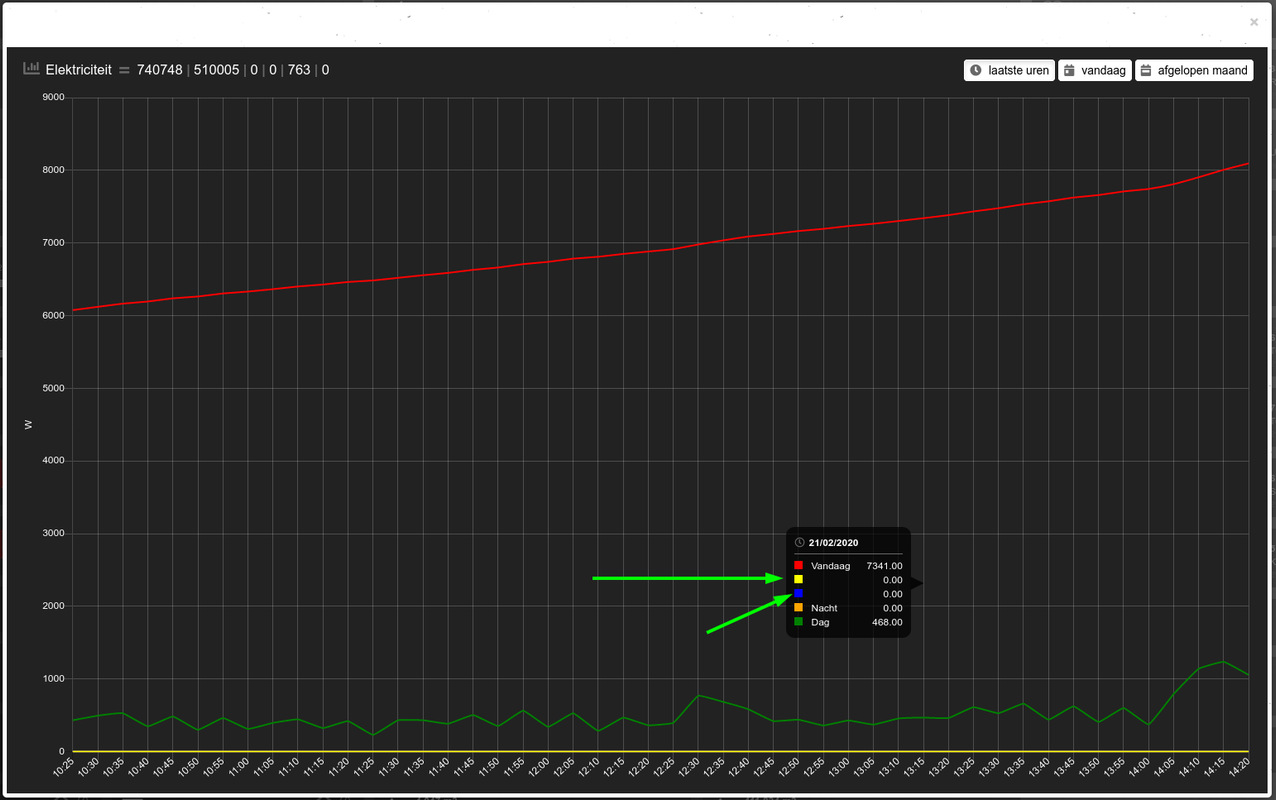
Popup electricity:
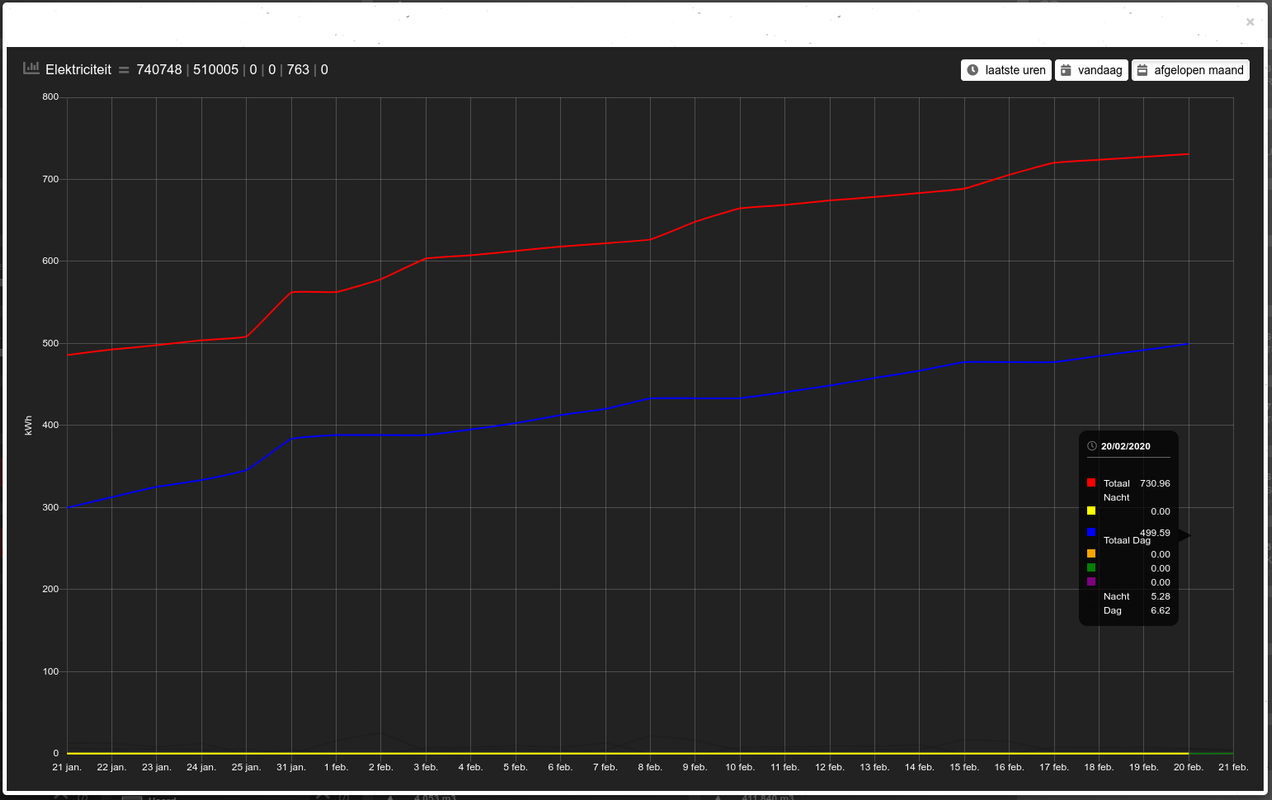
If there is not enough room to show the tool tip which is aligned left, the UoM somewhat wrecks the tool tip.
Popup multi graph (idx 89):
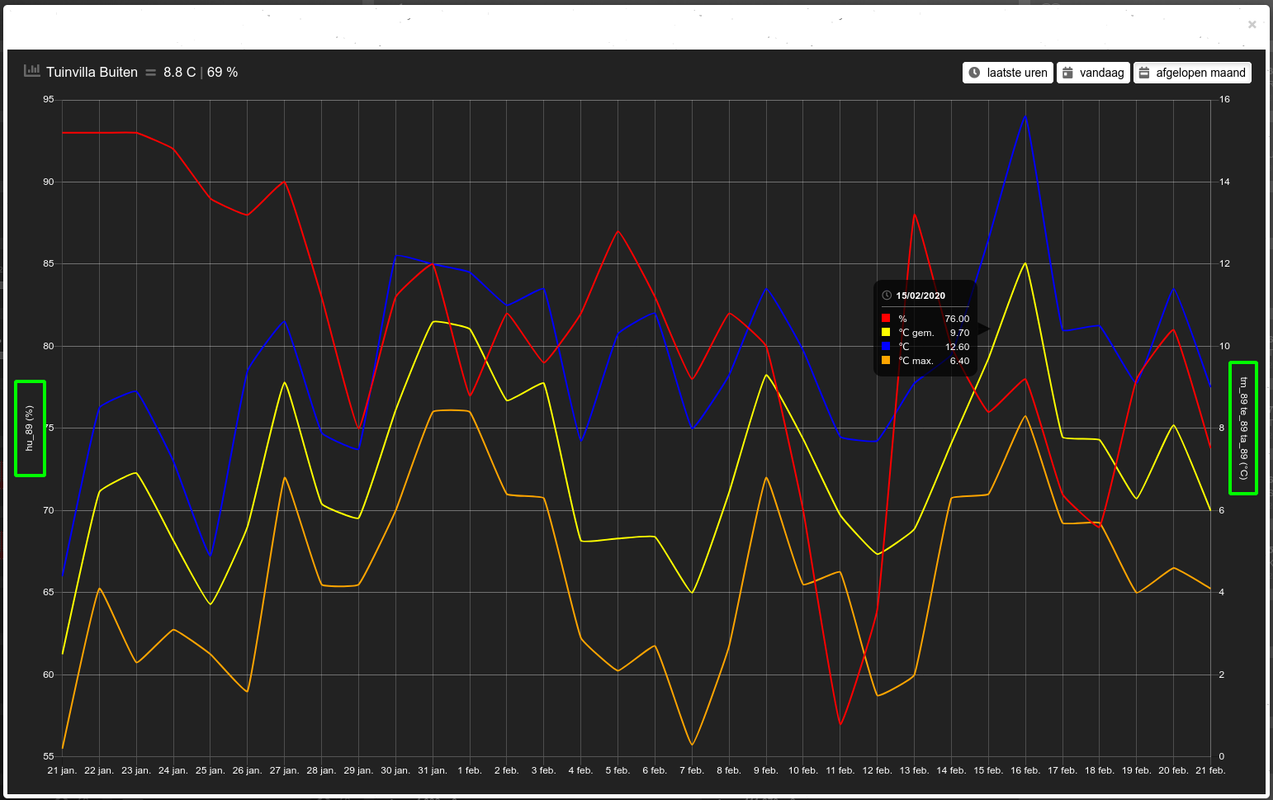
The UoM in the Y-axis legend is not using the definition in the custom.css
Despite all I am very happy with how the graphs work right now. It is a major improvement as far as I am concerned
Greetz,
Sjonnie
As your (currently) only crash test dummy I upgraded to the latest beta and applied the changes to the custom.css to test if all is working as you designed.
The custom.css code:
Code: Select all
/*
CUSTOM CSS FILE
*/

.popup_c1_199 {
	visibility: collapse;
}

.popup_c1_199:after {
	content: 'Totaal Nacht';
	float: left;
	margin-right: -25px;
	visibility: visible;
}

.popup_c2_199 {
/*	display: none !important;*/
    visibility: collapse
}

.popup_c3_199 {
	visibility: collapse;
}

.popup_c3_199:after {
	content: 'Totaal Dag';
	float: left;
	margin-right: -25px;
	visibility: visible;
}

.popup_c4_199 {
	visibility: collapse;
}

.popup_r1_199 {
	visibility: collapse;
}

.popup_r2_199 {
	visibility: collapse;
}

.popup_v_199 {
	visibility: collapse;
}

.popup_v_199:after {
	content: 'Nacht';
	float: left;
	margin-right: -25px;
	visibility: visible;
}

.popup_v2_199 {
	visibility: collapse;
}

.popup_v2_199:after {
	content: 'Dag';
	float: left;
	margin-right: -25px;
	visibility: visible;
}

.popup_eu_199 {
	visibility: collapse;
}

.popup_eu_199:after {
	content: 'Vandaag';
	float: left;
	margin-right: -25px;
	visibility: visible;
}

.popup_hu_89 {
	visibility: collapse;
}

.popup_hu_89:after {
	content: '%';
	float: left;
	margin-right: -25px;
	visibility: visible;
}

.popup_ta_89 {
	visibility: collapse;
}

.popup_ta_89:after {
	content: '℃ gem.';
	float: left;
	margin-right: -25px;
	visibility: visible;
}

.popup_te_89 {
	visibility: collapse;
}

.popup_te_89:after {
	content: '℃';
	float: left;
	margin-right: -25px;
	visibility: visible;
}

.popup_tm_89 {
	visibility: collapse;
}

.popup_tm_89:after {
	content: '℃ max.';
	float: left;
	margin-right: -25px;
	visibility: visible;
}
Dashboard electricity:

A bit too much info in the header here and the UoM is shown in Watt instead of kilowatt.
Popup electricity:

Also here too much info in the header and I would like to suppress the values I don't use. I have tried:
Code: Select all
display: noneCode: Select all
display: none !importantJust another sample:

Popup electricity:

If there is not enough room to show the tool tip which is aligned left, the UoM somewhat wrecks the tool tip.
Popup multi graph (idx 89):

The UoM in the Y-axis legend is not using the definition in the custom.css
Despite all I am very happy with how the graphs work right now. It is a major improvement as far as I am concerned
Greetz,
Sjonnie
ConBee II - TRÅDFRI lights + switches, loads of ChingLing dimmers and switches, Heiman and Xiaomi sensors
SolarEdge SE4000H (with active modbus_tcp)
YouLess Energy meter
Shelly 2.5 in roller shutter mode
SolarEdge SE4000H (with active modbus_tcp)
YouLess Energy meter
Shelly 2.5 in roller shutter mode
- clinkadink
- Posts: 417
- Joined: Tuesday 31 December 2019 1:15
- Target OS: Linux
- Domoticz version: 2020.2
- Location: Swindon, UK
- Contact:
Re: Multiple sources in one graph
Thanks again for testing this. I will fix the header, it was updated in this latest update.Sjonnie2017 wrote: Friday 21 February 2020 14:56 Dashboard electricity:
A bit too much info in the header here and the UoM is shown in Watt instead of kilowatt.
I am going to change the solution for Popup tooltips. I am not happy with it, its currently not good enoughSjonnie2017 wrote: Friday 21 February 2020 14:56 If there is not enough room to show the tool tip which is aligned left, the UoM somewhat wrecks the tool tip.
"UI is the saddle, the stirrups, & the reins. UX is the feeling you get being able to ride the horse."
-
jake
- Posts: 751
- Joined: Saturday 30 May 2015 22:40
- Target OS: Raspberry Pi / ODroid
- Domoticz version: beta
- Contact:
Re: Multiple sources in one graph
Although adding a multi graph to my dashboard was there ever since the functionality was introduced, I only found time today to dig into it. The results are awesome, especially with the 'zoom' allowed!
To find some nice color schemes for graphs, you can visit this website: http://colorbrewer2.org/#type=diverging&scheme=RdGy&n=6
There you can select the amount of colors, color scheme etc etc. With the 'export' option in the middle of the screen, you can pick RGB and rightaway have your dataColorSet at hand! Might be an interesting link for the wiki.
some samples I tried and are stored in my config.js:
//datasetColors: ['red', 'blue', 'yellow', 'orange', 'green', 'purple']
//color scheme taken from http://colorbrewer2.org/#type=diverging&scheme=RdGy&n=6
//datasetColors: ['rgb(178,24,43)','rgb(239,138,98)','rgb(253,219,199)','rgb(224,224,224)','rgb(153,153,153)','rgb(77,77,77)']
datasetColors: ['rgb(102,194,165)','rgb(252,141,98)','rgb(141,160,203)','rgb(231,138,195)','rgb(166,216,84)','rgb(255,217,47)']
- Sjonnie2017
- Posts: 372
- Joined: Wednesday 02 August 2017 19:43
- Target OS: Linux
- Domoticz version: Latest ß
- Location: The Netherlands
- Contact:
Re: Multiple sources in one graph
Excellent! I'll be waiting for your update.clinkadink wrote: Friday 21 February 2020 23:08Thanks again for testing this. I will fix the header, it was updated in this latest update.Sjonnie2017 wrote: Friday 21 February 2020 14:56 Dashboard electricity:
A bit too much info in the header here and the UoM is shown in Watt instead of kilowatt.
Well... I was rather pleased with it. Although I can imagine you look at that differently.clinkadink wrote: Friday 21 February 2020 23:08I am going to change the solution for Popup tooltips. I am not happy with it, its currently not good enoughSjonnie2017 wrote: Friday 21 February 2020 14:56 If there is not enough room to show the tool tip which is aligned left, the UoM somewhat wrecks the tool tip.
Question: would the next update possibly fix the suppressing of unwanted values in the popup graphs?
Thanks again for all your hard work!
Greetz,
Sjonnie
ConBee II - TRÅDFRI lights + switches, loads of ChingLing dimmers and switches, Heiman and Xiaomi sensors
SolarEdge SE4000H (with active modbus_tcp)
YouLess Energy meter
Shelly 2.5 in roller shutter mode
SolarEdge SE4000H (with active modbus_tcp)
YouLess Energy meter
Shelly 2.5 in roller shutter mode
- Sjonnie2017
- Posts: 372
- Joined: Wednesday 02 August 2017 19:43
- Target OS: Linux
- Domoticz version: Latest ß
- Location: The Netherlands
- Contact:
Re: Multiple sources in one graph
Hi Clinkadink,
Thought I'd show you how well the multi graphs work with multiple sensors. I have one sensor per room providing 3 different IDX values per reading. This is how it looks:
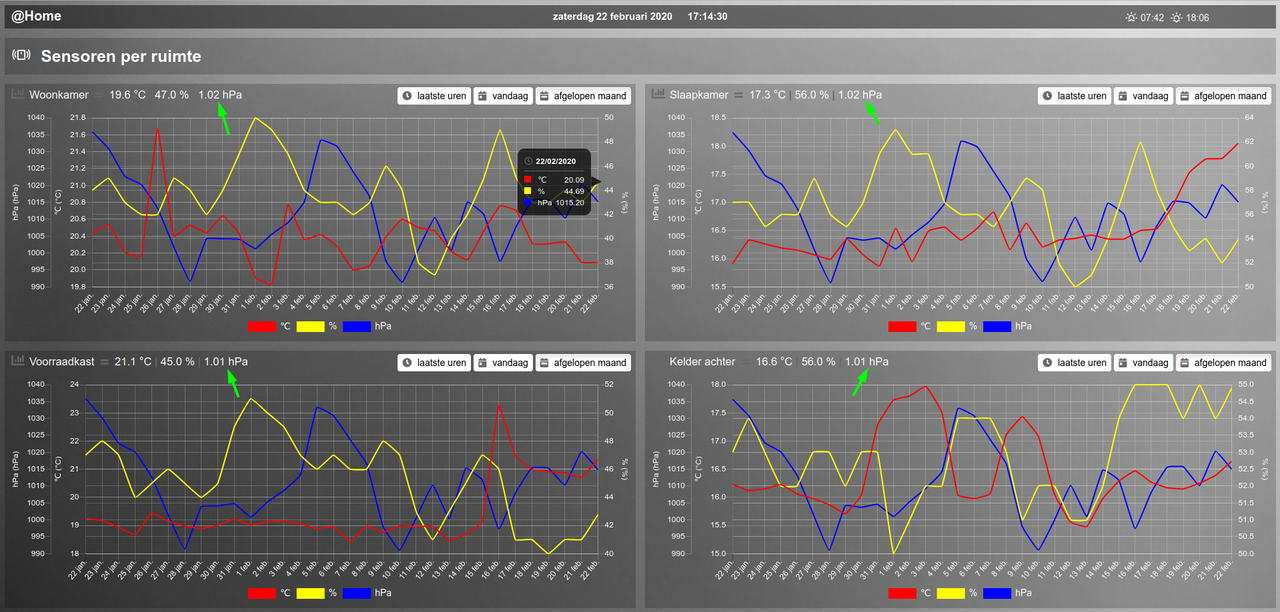
Only thing is the value of the barometer (which works in the tool tips and legend but not in the header)
Looks great so thanks!
Greetz,
Sjonnie
Thought I'd show you how well the multi graphs work with multiple sensors. I have one sensor per room providing 3 different IDX values per reading. This is how it looks:

Only thing is the value of the barometer (which works in the tool tips and legend but not in the header)
Looks great so thanks!
Greetz,
Sjonnie
ConBee II - TRÅDFRI lights + switches, loads of ChingLing dimmers and switches, Heiman and Xiaomi sensors
SolarEdge SE4000H (with active modbus_tcp)
YouLess Energy meter
Shelly 2.5 in roller shutter mode
SolarEdge SE4000H (with active modbus_tcp)
YouLess Energy meter
Shelly 2.5 in roller shutter mode
- clinkadink
- Posts: 417
- Joined: Tuesday 31 December 2019 1:15
- Target OS: Linux
- Domoticz version: 2020.2
- Location: Swindon, UK
- Contact:
Re: Multiple sources in one graph
Great, glad you are finding the new functionality useful. And thanks for the feedback.jake wrote: Saturday 22 February 2020 14:46 Although adding a multi graph to my dashboard was there ever since the functionality was introduced, I only found time today to dig into it. The results are awesome, especially with the 'zoom' allowed!
This is a very helpful resource, I have bookmarked. Thank youjake wrote: Saturday 22 February 2020 14:46 To find some nice color schemes for graphs, you can visit this website: http://colorbrewer2.org/#type=diverging&scheme=RdGy&n=6
"UI is the saddle, the stirrups, & the reins. UX is the feeling you get being able to ride the horse."
- clinkadink
- Posts: 417
- Joined: Tuesday 31 December 2019 1:15
- Target OS: Linux
- Domoticz version: 2020.2
- Location: Swindon, UK
- Contact:
Re: Multiple sources in one graph
That is the plan, but I have yet been able to work on this new solution yet. Hopefully will get some time tomorrowSjonnie2017 wrote: Saturday 22 February 2020 16:20 Question: would the next update possibly fix the suppressing of unwanted values in the popup graphs?
"UI is the saddle, the stirrups, & the reins. UX is the feeling you get being able to ride the horse."
- clinkadink
- Posts: 417
- Joined: Tuesday 31 December 2019 1:15
- Target OS: Linux
- Domoticz version: 2020.2
- Location: Swindon, UK
- Contact:
Re: Multiple sources in one graph
Thanks, your graphs do look good. Clear and concise information.Sjonnie2017 wrote: Saturday 22 February 2020 17:20 Only thing is the value of the barometer (which works in the tool tips and legend but not in the header)
Regarding the header. Some people want the extra info displayed, some people don't - especially those who are using smaller resolution displays (which is understandable). E.g. here: https://www.domoticz.com/forum/viewtopi ... 20#p237740
The update basically displayed all data for devices with multidata available (sub-devices), such as yours. The code has not changed the data, so the "device.Data" property (provided by Domiticz) must already be showing "1.02 hPa".
In my opinion, there are 2 options:
- Go back to how it was before this last update, with header only displaying the first bit of data. E.g. in your case "19°C"
- Implement a new block property allowing the user to show the standard header (option 1 above) or the "extra" header (as it does today). But this would also mean that this "extra" sub-device data would need formatting for each device type/subtype. E.g. Thermostats, P1 Energy Meters, Wind, Weather, etc. This would take several iterations before all device data was formatted and displaying correctly.
"UI is the saddle, the stirrups, & the reins. UX is the feeling you get being able to ride the horse."
- Sjonnie2017
- Posts: 372
- Joined: Wednesday 02 August 2017 19:43
- Target OS: Linux
- Domoticz version: Latest ß
- Location: The Netherlands
- Contact:
Re: Multiple sources in one graph
I think a new block property would be the best option. It gives users a choice of what they want to see. I will test all minor and major versions of the software if you like 
ConBee II - TRÅDFRI lights + switches, loads of ChingLing dimmers and switches, Heiman and Xiaomi sensors
SolarEdge SE4000H (with active modbus_tcp)
YouLess Energy meter
Shelly 2.5 in roller shutter mode
SolarEdge SE4000H (with active modbus_tcp)
YouLess Energy meter
Shelly 2.5 in roller shutter mode
Who is online
Users browsing this forum: No registered users and 1 guest