Page 6 of 15
Re: Multiple sources in one graph
Posted: Saturday 08 February 2020 14:30
by Sjonnie2017
Back in the ring

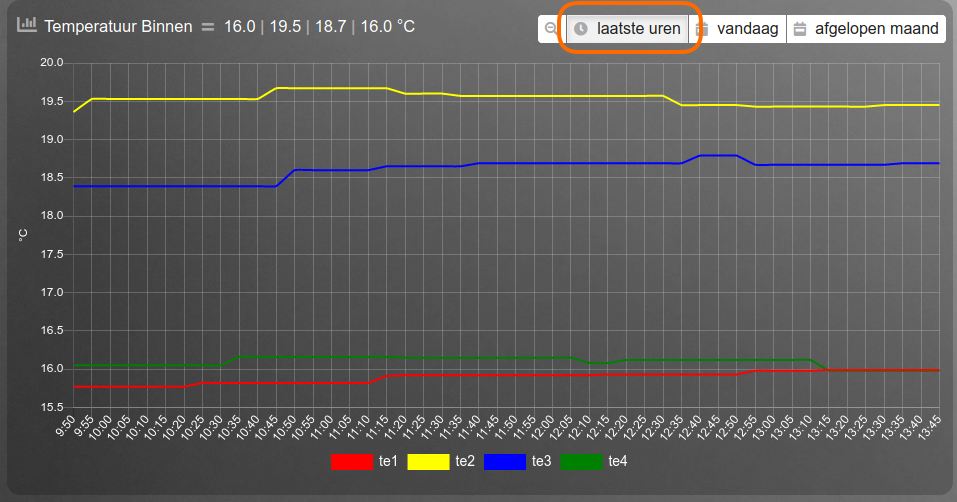
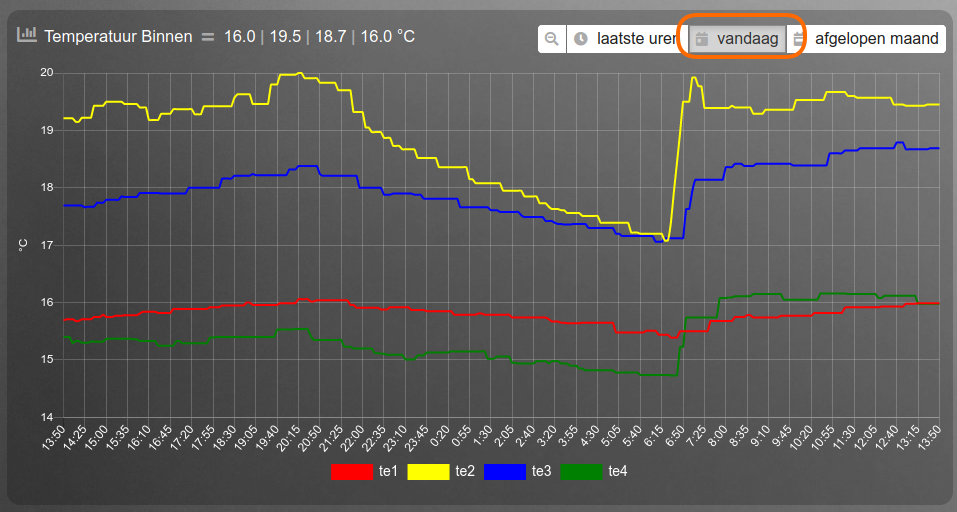
Been experimenting yesterday with a multitude of settings to get the colors in the different graphs the same. I didn't succeed but I think I have found the source of my "problem"
I created a datasetColor for all 12 readings for temperature. Disabled filtering several readings and set Legend to true.
Reading -- datasetColor -- desired color
TA1-------- red
TE1-------- yellow
TM1-------- blue
TA2-------- green
TE2-------- beige
TM2-------- aqua
TA3-------- blueviolet
TE3-------- chartreuse
TM3-------- pink
TA4-------- greenyellow
TE4-------- indigo
TM4-------- lightgreen
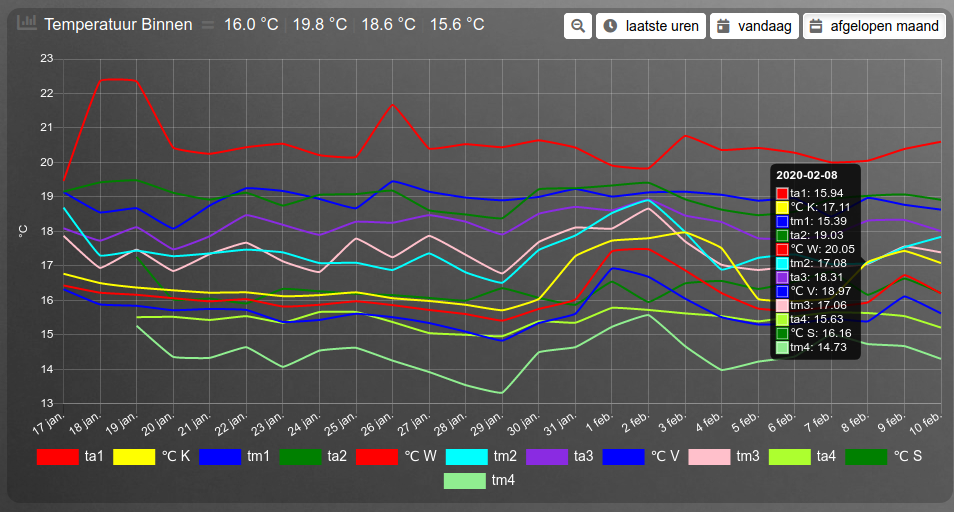
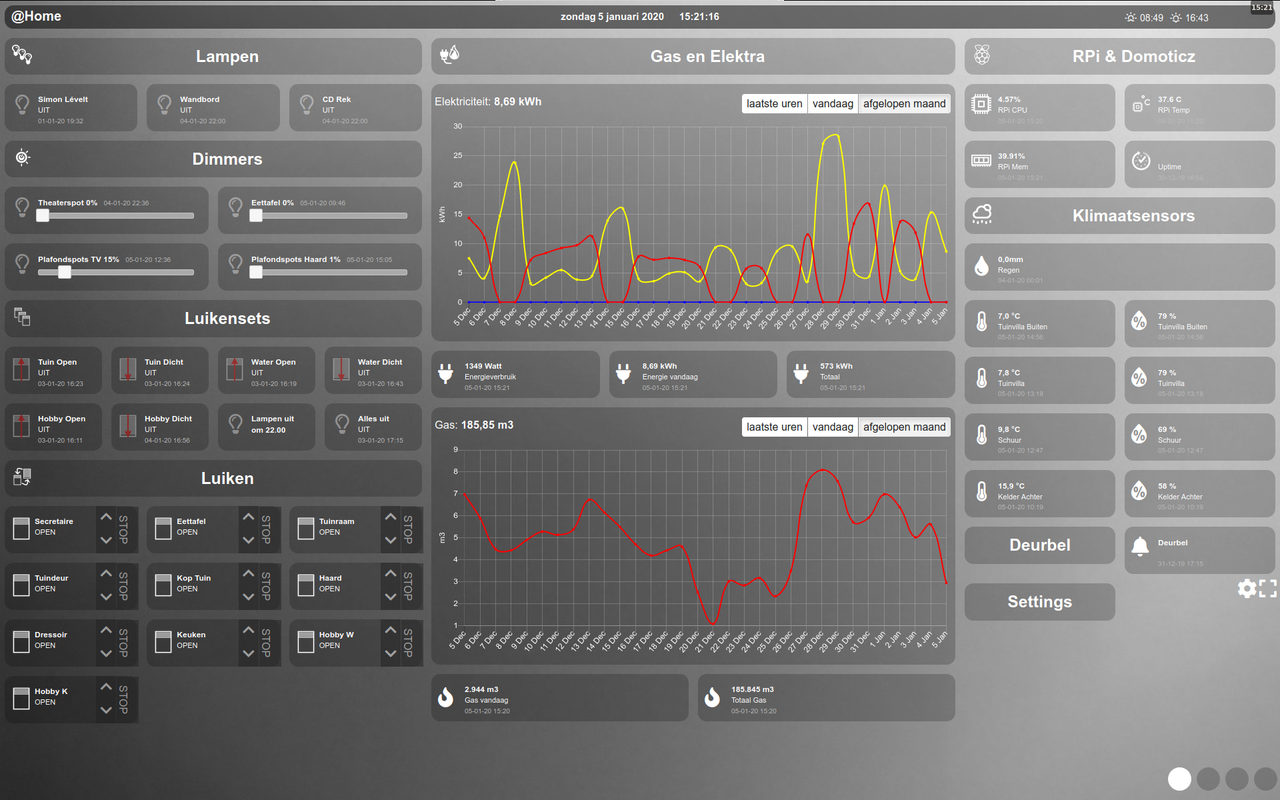
So with the above datasetColors the graphs for 'last hours' and 'today' look like these:


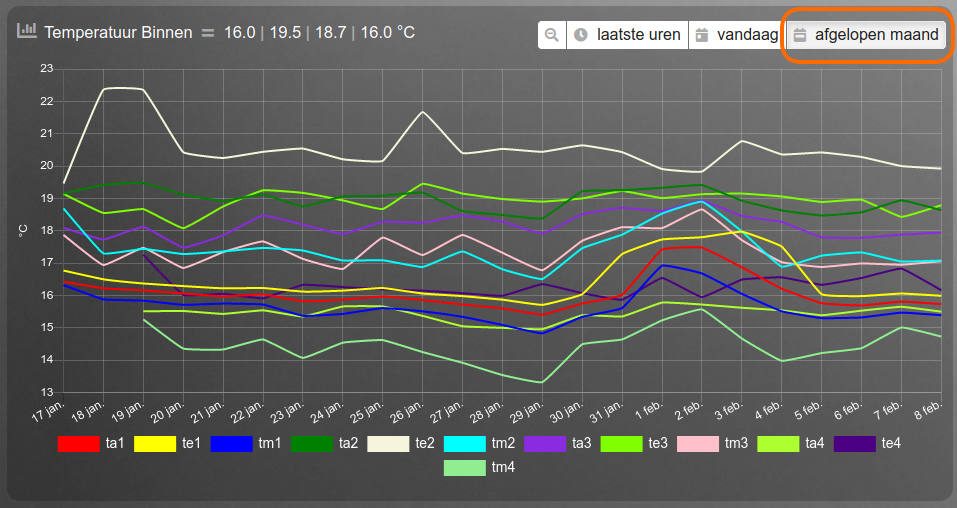
And the graph for last month looks like this:

The code I used for above graphs:
Code: Select all
blocks['multigraph_144'] = {
	title: 'Temperatuur Binnen',
        devices: [ 144, 145, 152, 158],
        sortDevices: false,
	datasetColors: ['red', 'yellow', 'blue', 'green', 'beige', 'aqua', 'blueviolet', 'chartreuse', 'pink', 'greenyellow', 'indigo', 'lightgreen', 'seashell'],
	spanGaps: true,
	graph: 'line',
	legend: true
}
As @clinkadink explained te# for day and last hours is the actual temperature and tm# is used for last month and is the maximum temperature. And I think there lies the source of the "problem'.
If I change
beige to
yellow,
chartreuse to
blue and
indigo to
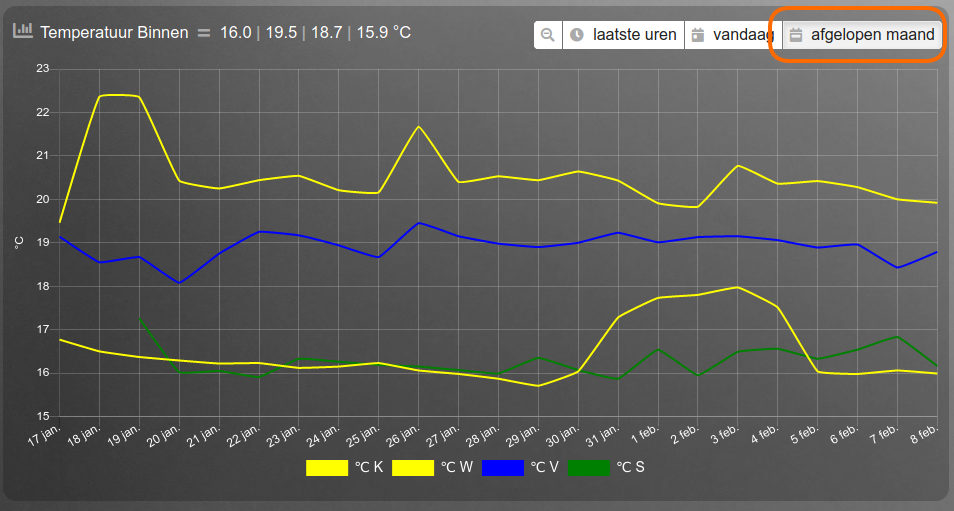
green (and filter the readings) then the better part of the graph for last month is looking fine:

And the code that goes with it:
Code: Select all
blocks['multigraph_144'] = {
	title: 'Temperatuur Binnen',
        devices: [ 144, 145, 152, 158],
        sortDevices: false,
	datasetColors: ['red', 'yellow', 'blue', 'green', 'yellow', 'aqua', 'blueviolet', 'blue', 'pink', 'greenyellow', 'green', 'lightgreen', 'seashell'],
	spanGaps: true,
	graph: 'line',
	legend: {
        'te1': '℃ K',
//	'ta1': '℃ K(avg)',
//	'tm1': '℃ K(min)',
        'te2': '℃ W',
//	'ta2': '℃ W(avg)',
//	'tm2': '℃ W(min)',
	'te3': '℃ V',
//	'ta3': '℃ V(avg)',
//	'tm3': '℃ V(min)',
	'te4': '℃ S'
//	'ta4': '℃ S(avg)',
//	'tm4': '℃ S(min)',
   }
}
Somehow I think the color for TM1 is selected not as the third color (which I expected but also does not resolve my issue) but the second (yellow).
If anyone has a bright idea how to get tm1 to show up red in my graph without "ruining" the other two graphs I am "all ears"

Greetz,
Sjonnie
Re: Multiple sources in one graph
Posted: Saturday 08 February 2020 15:08
by clinkadink
Thanks for the info.
The datasetColors will be applied to each key in the order they are returned. So in your case,
red is the first key, "
te1", yellow is the second key, "te2", etc. But when switching to month range, the data includes a new key, "ta1", which comes before "te1" alphabetically. And since red applies to the first key, "
ta1" becomes
red, and "te1" becomes yellow.
The code doesn't currently cater for this. One way to do this, would be creating a relationship between the key and the color. But that wouldn't be a simple change. Example:
Code: Select all
legend: [
  { te1: "D1 Temp", keyColor: "red" },
  { ta1: "D1 Temp (avg)", keyColor: "yellow" },
  { tm1: "D1 Temp (min)", keyColor: "blue" },
  { hu2: "D2 Humidity", keyColor: "green" },
  { te3: "D3 Temp", keyColor: "grey" },
  { ta3: "D3 Temp (avg)", keyColor: "orange" },
  { tm3: "D3 Temp (min)", keyColor: "pink" },
  { ba3: "D3 Pressure", keyColor: "purple" }
]
Did you try sorting the draw order of the graphs? Check out the beta documentation, specifically
drawOrderMonth.
drawOrderMonth:
an array stating the order in which each dataset should be added to the graph for “last month”, e.g. [‘v1’, ‘v2’, ‘c1’, ‘c2’]
https://dashticz.readthedocs.io/en/beta ... raphs.html
Cheers

Re: Multiple sources in one graph
Posted: Saturday 08 February 2020 15:35
by Sjonnie2017
[EDIT]: Missed the reply of @clinkadink

Well if you're experimenting, you'd better keep experimenting

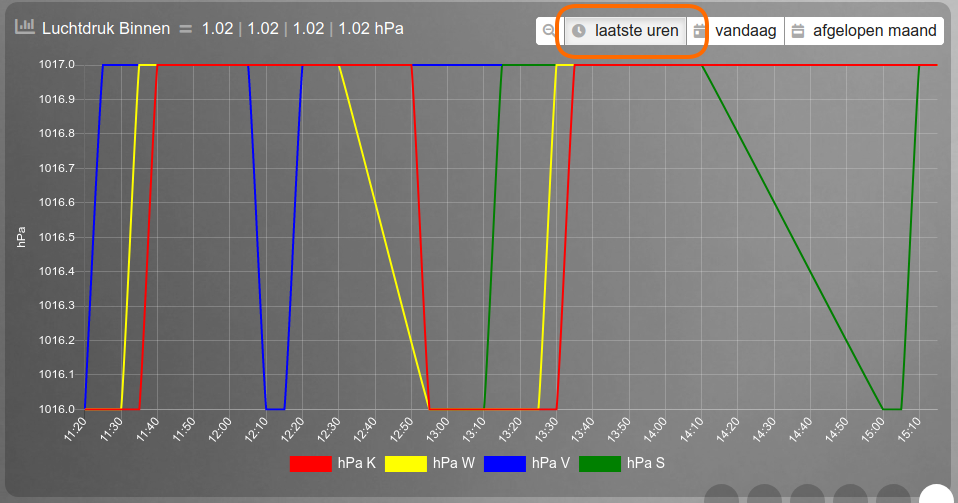
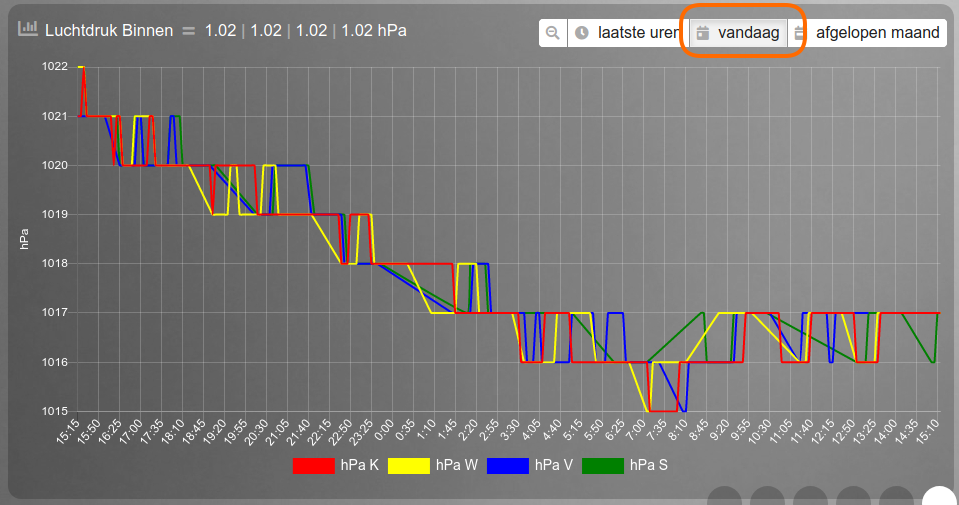
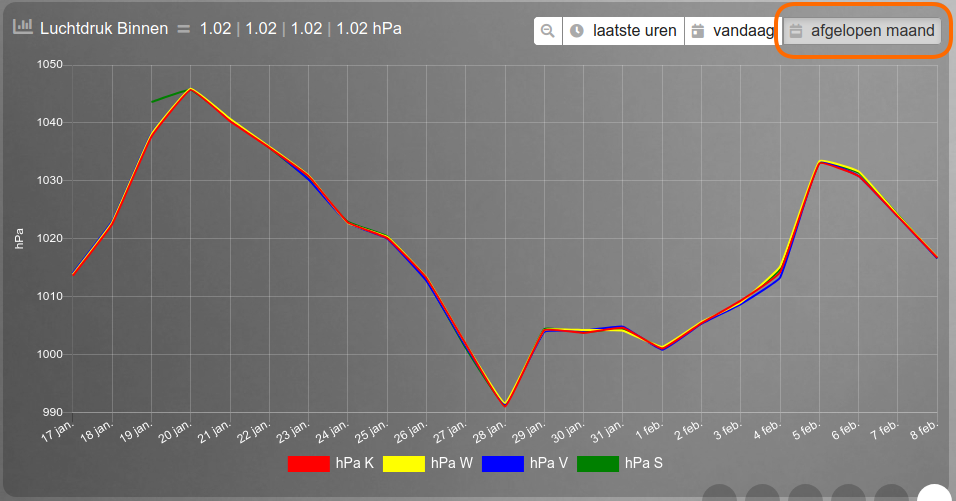
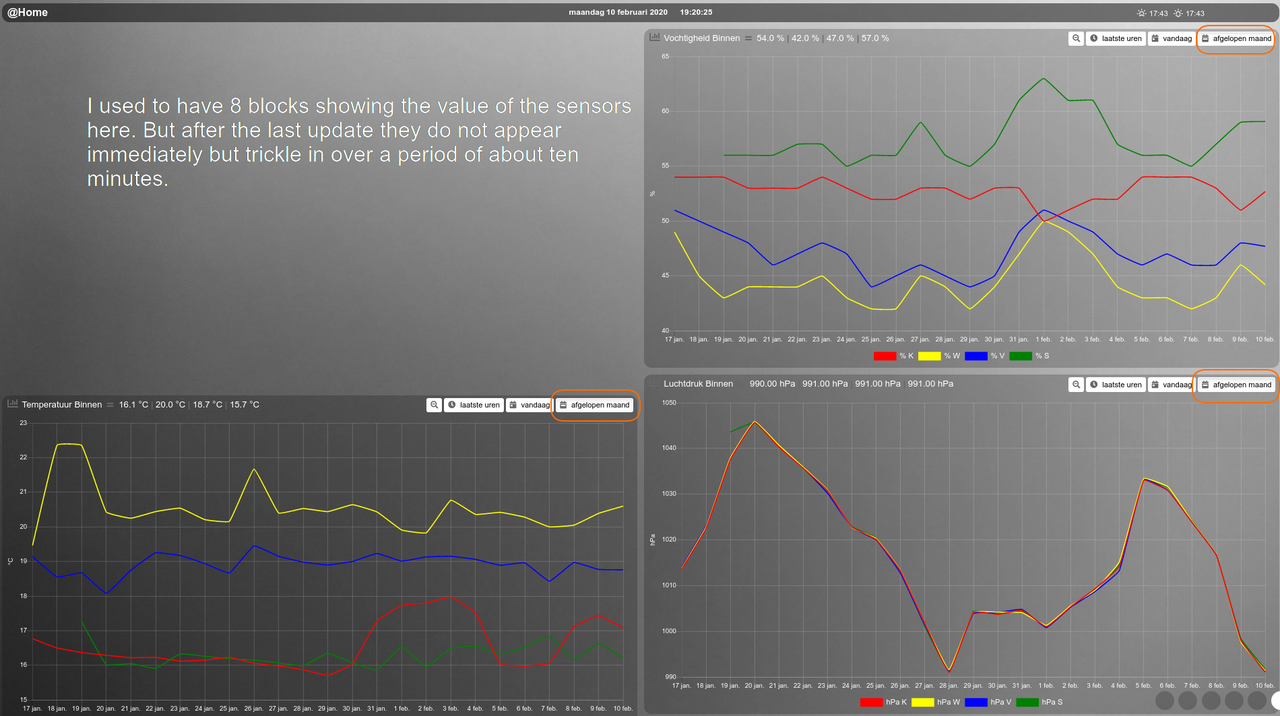
I have been working on my multi-graph for the barometer readings of the four Aqara sensors. That seemed to work out pretty nice

The graphs:


The code:
Code: Select all
blocks['multigraph_147'] = {
	title: 'Luchtdruk Binnen',
    devices: [ 147, 149, 154, 160],
    sortDevices: true,
	datasetColors: ['red', 'yellow', 'blue', 'green', 'green', 'brown', 'yellow', 'aqua'],
	spanGaps: true,
	multigraphTypes: [ 'ba'],
	graph: 'line',
	legend: {
      'ba1': 'hPa K',
      'ba2': 'hPa W',
      'ba3': 'hPa V',
      'ba4': 'hPa S'
    }
}
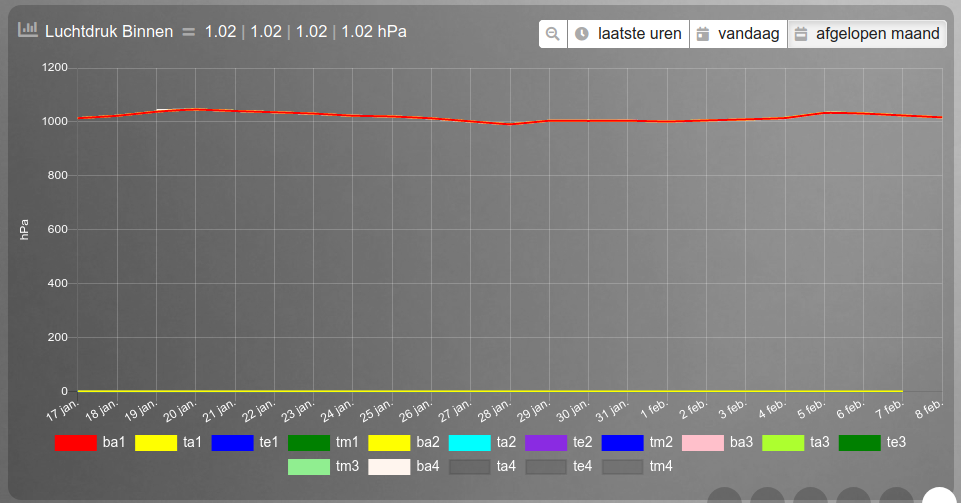
If I change this to legend is true and 'rem' out the legend apart you see above I get this (I am only showing Last Month):

The code:
Code: Select all
blocks['multigraph_147'] = {
	title: 'Luchtdruk Binnen',
    devices: [ 147, 149, 154, 160],
    sortDevices: true,
	datasetColors: ['red', 'yellow', 'blue', 'green', 'yellow', 'aqua', 'blueviolet', 'blue', 'pink', 'greenyellow', 'green', 'lightgreen', 'seashell'],
	spanGaps: true,
	graph: 'line',
	legend: true
}
Somehow I think the two graphs are interpreted differently but I could be mistaken.
Greetz,
Sjonnie
Re: Multiple sources in one graph
Posted: Saturday 08 February 2020 15:53
by Sjonnie2017
clinkadink wrote: ↑Saturday 08 February 2020 15:08
Thanks for the info.
The datasetColors will be applied to each key in the order they are returned. So in your case,
red is the first key, "
te1", yellow is the second key, "te2", etc. But when switching to month range, the data includes a new key, "ta1", which comes before "te1" alphabetically. And since red applies to the first key, "
ta1" becomes
red, and "te1" becomes yellow.
The code doesn't currently cater for this. One way to do this, would be creating a relationship between the key and the color. But that wouldn't be a simple change. Example:
Code: Select all
legend: [
  { te1: "D1 Temp", keyColor: "red" },
  { ta1: "D1 Temp (avg)", keyColor: "yellow" },
  { tm1: "D1 Temp (min)", keyColor: "blue" },
  { hu2: "D2 Humidity", keyColor: "green" },
  { te3: "D3 Temp", keyColor: "grey" },
  { ta3: "D3 Temp (avg)", keyColor: "orange" },
  { tm3: "D3 Temp (min)", keyColor: "pink" },
  { ba3: "D3 Pressure", keyColor: "purple" }
]
Did you try sorting the draw order of the graphs? Check out the beta documentation, specifically
drawOrderMonth.
drawOrderMonth:
an array stating the order in which each dataset should be added to the graph for “last month”, e.g. [‘v1’, ‘v2’, ‘c1’, ‘c2’]
https://dashticz.readthedocs.io/en/beta ... raphs.html
Cheers

I tried the drawOrderMonth in multiple configurations. The colors are OK (ie. red, yellow, blue, green) but in the month graph the color for the first two readings are switched. So #1 shows red in last hours and today and shows yellow in month. And #2 shows exactly the opposite.
My Pi is heating up and so is my brain so I am going to let both cool down a bit before I restart experimenting further


Greetz,
Sjonnie
EDIT: Would custom.css be a place to assign the right color to the appropriate reading? (still cooling of

)
Re: Multiple sources in one graph
Posted: Saturday 08 February 2020 17:06
by clinkadink
Re: Multiple sources in one graph
Posted: Saturday 08 February 2020 17:40
by Sjonnie2017
Almost completely cooled off

Yup! I tried that as well. If you want I can produce a picture of the graph how it looks with this setting. Just let me know if that would be helpful.
Greetz,
Sjonnie
Re: Multiple sources in one graph
Posted: Monday 10 February 2020 1:08
by dgrostoto
Hello,
First thanks for the multigraph which add much value to dashticz.
I tried to combine on one graph using multigraph, kwh and temperature (to correlate energy consumption and resulting heating), but the best i've succeed so far result in only one y axis. Could it be possible to define custom two Y axis (like the baro temp device graph) and let the user define which data is stuck to which axis ?
Re: Multiple sources in one graph
Posted: Monday 10 February 2020 3:07
by clinkadink
dgrostoto wrote: ↑Monday 10 February 2020 1:08
Could it be possible to define custom two Y axis (like the baro temp device graph)?
This is now corrected in the latest beta. More info here:
https://www.domoticz.com/forum/viewtopi ... 67&t=31288
Re: Multiple sources in one graph
Posted: Monday 10 February 2020 9:19
by dgrostoto
this is better (the legend top left now report good units).
But I still did not manage to get two axis functionnal, only the first one is used :
blocks['multigraph_3'] = {
devices : [ 3,103,101,158 ],
graphTypes: ['te','te','v','v'],
//drawOrderDay: ['te1', 'te2', 'v3', 'v4' ],
graph: 'line',
custom : {
"24 hours": {
range: 'day',
filter: '24 hours',
ylabels: [ 'C','kWh' ],
data: {
te1 : 'd.te1',
te2 : 'd.te2',
v3 : 'd.v3/1000',
v4 : 'd.v4/1000'
}
}
},
legend: {
te1: 'Temp Salon',
te2: 'Temp ext',
v3: 'Radiateurs',
v4: 'Clim'
}
}
(device 3 is te only, 103 is te + hu, both 101 and 158 are counter type general and subtype kWh)
the graph is attached below.
See the value pointed by mouse : they only use the left Yaxis and none of the data use Yaxis on the right.
Re: Multiple sources in one graph
Posted: Monday 10 February 2020 18:04
by Sjonnie2017
Installed 3.4.0 today and got treated to a surprise.
The code now seems to ignore the excluded values in the graph:

Fragment of custom.js
Code: Select all
// multigraph settings
config['graph_zoom'] = 1;
Code: Select all
blocks['multigraph_144'] = {
	title: 'Temperatuur Binnen',
    devices: [ 144, 145, 152, 158],
    sortDevices: true,
//	datasetColors: ['red', 'yellow', 'blue', 'green', 'beige', 'aqua', 'blueviolet', 'chartreuse', 'pink', 'greenyellow', 'indigo', 'lightgreen', 'seashell'],
	datasetColors: ['red', 'yellow', 'blue', 'green', 'red', 'aqua', 'blueviolet', 'blue', 'pink', 'greenyellow', 'green', 'lightgreen', 'seashell'],
	drawOrderMonth: [ 'te1', 'te2', 'te3', 'te4'],
	spanGaps: true,
//	cartesian: 'logarithmic',
//	exclude: [ 'hu', 'ba'],
	graph: 'line',
//	legend: true,
	legend: {
          'te1': '℃ K',
//	  'ta1': '℃ K(avg)',
//	  'tm1': '℃ K(min)',
          'te2': '℃ W',
//	  'ta2': '℃ W(avg)',
//	  'tm2': '℃ W(min)',
	  'te3': '℃ V',
//	  'ta3': '℃ V(avg)',
//	  'tm3': '℃ V(min)',
	  'te4': '℃ S'
//	  'ta4': '℃ S(avg)',
//	  'tm4': '℃ S(min)',
   }
}
Re: Multiple sources in one graph
Posted: Monday 10 February 2020 18:12
by Sjonnie2017
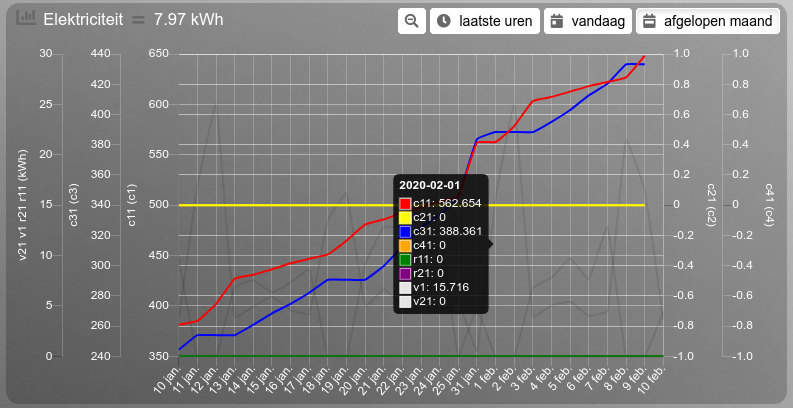
And another I noticed is my changed electricity graph:
Old:

New:

I love the legend on the Y-axis but am confused about all the (new) values.
Re: Multiple sources in one graph
Posted: Monday 10 February 2020 18:55
by dgrostoto
How did you manage to get so many Yaxis ? can you post your graph defintion ? (and tell which type of devices are the devices declared in the block ?
Re: Multiple sources in one graph
Posted: Monday 10 February 2020 19:14
by Sjonnie2017
I upgraded to latest beta (3.4.0) in which the Y-axis legends are introduced. I would show you my code but it would not make sense because the display of the graph is not what it is supposed to be. I am experimenting now with some info that I have found. Will post back soon.
Re: Multiple sources in one graph
Posted: Monday 10 February 2020 19:19
by Sjonnie2017
Well I added/changed the blocks of the sensors with the "graphTypes" and now they look rather spiffy


[EDIT]: Could the websocket thingy be the cause of the sensors showing up so late? So to get that to work I should upgrade to beta branch of Domoticz?
Unfortunately my "old" electricity graph does not change (it already had the graphTypes defined in the block).
@dgrostoto: I don't think it will be mutch help to you but here is the code of my electricity graph:
Code: Select all
blocks[grafiek_elektra] = {}
blocks[grafiek_elektra]['title'] = 'Elektriciteit';
blocks[grafiek_elektra]['width'] = 12;
blocks[grafiek_elektra]['height'] = '400px';
//blocks[grafiek_elektra]['graph'] = 'bar';
blocks[grafiek_elektra]['legend'] = {'v': 'Nacht', 'v2': 'Dag'}
blocks[grafiek_elektra]['graphTypes'] = ['v', 'v2'];
blocks[grafiek_elektra]['pointFillColors'] = ['#aaa9a9', '#7e7e7e'];
blocks[grafiek_elektra]['pointSize'] = 3;
blocks[grafiek_elektra]['lineColors'] = ['#aaa9a9', '#7e7e7e'];
Re: Multiple sources in one graph
Posted: Monday 10 February 2020 20:29
by clinkadink
Sjonnie2017 wrote: ↑Monday 10 February 2020 18:04
The code now seems to ignore the excluded values in the graph
Originally, there was "exclude", to remove keys from the returned data. This is yours at the moment ...
But now this has been replaced, with the existing "graphTypes" param. This provides the opposite capability, it tells Dashticz what to display from the returned data. Try this ...
Re: Multiple sources in one graph
Posted: Monday 10 February 2020 20:40
by clinkadink
dgrostoto wrote: ↑Monday 10 February 2020 18:55
How did you manage to get so many Yaxis ? can you post your graph defintion ? (and tell which type of devices are the devices declared in the block ?
The graph will check all datasets and each unit of measure, e.g. °C, kmh, mm, etc. Any datasets that share the same unit of measure, will share the same Y axis. The keys in Sjonnie's graph have not been associated with any units of measure, so the raw key name is used, e.g. c1, c2, c3. Therefore, the graph creates a Y axis for each unique unit of measure - hence the 4 Y axes.
In other words, if all datasets are have unit of "°C", then there will be only one Y axis. Otherwise, there will be one per unit.
Sjonnie2017 wrote: ↑Monday 10 February 2020 18:12
I love the legend on the Y-axis but am confused about all the (new) values.
Please can you provide me with device's type/subtype?
Re: Multiple sources in one graph
Posted: Monday 10 February 2020 20:50
by clinkadink
Sjonnie2017 wrote: ↑Monday 10 February 2020 19:19
Could the websocket thingy be the cause of the sensors showing up so late? So to get that to work I should upgrade to beta branch of Domoticz?
To temporarily disable the websocket to test, add this to your config.js:
Code: Select all
config['enable_websocket'] = false;
Re: Multiple sources in one graph
Posted: Monday 10 February 2020 21:11
by clinkadink
Sjonnie2017 wrote: ↑Monday 10 February 2020 18:12
I love the legend on the Y-axis but am confused about all the (new) values.
Which bit? Seems clear to me

I mentioned in the previous post, I need to know what device type and subtype are, and what the unit of measures are for c1, c2, c3 and c4. Once provided, I can get the code updated to recognise these keys, so they display the correct unit of measure. After that, you probably won't have 4 Y axes, as I am guessing that c2 and c4 are both the same unit of measure, and maybe even c1 and c3 too.

Re: Multiple sources in one graph
Posted: Monday 10 February 2020 23:08
by Lokonli
Sjonnie2017 wrote:
[EDIT]: Could the websocket thingy be the cause of the sensors showing up so late? So to get that to work I should upgrade to beta branch of Domoticz?
Which Domoticz version are you using?
Dashticz doesn't switch from a http connection to a websocket connection for older Domoticz versions.
There is no need to switch to the Domoticz beta branch unless you want to use the websocket connection.
Sent from my SM-A320FL using Tapatalk
Re: Multiple sources in one graph
Posted: Tuesday 11 February 2020 7:27
by dgrostoto
My graph avec two differents unit (celcius and kwh) but if i don't specify "ylabels" i only have one yaxis.
So what i did wrong ?
my code
Code: Select all
blocks['multigraph_3'] = {
	devices : [ 3,103,101,158 ],
	graphTypes: ['te','te','v','v'],
	//drawOrderDay:   ['te1', 'te2', 'v3', 'v4' ],
	graph: 'line',
	custom : {
		"24 hours": {
			range: 'day',
			filter: '12 hours',
			data: {
				te1 : 'd.te1',
				te2 : 'd.te2',
				v3 : '5*d.v3/1000',
				v4 : '5*d.v4/1000'
			}
		}
	},
	legend: {
		te1: 'Temp Salon',
		te2: 'Temp ext',
		v3: 'Radiateurs',
		v4: 'Clim'
	}
}
@Sjonnie2017
In your post, how do you refer to device idx ? (since there is no number in title graph nor device option)
https://www.domoticz.com/forum/posting. ... 7&p=236375

