
I would like to suppress R2 and R1 in my Smart Meter graph as I don't have solar panels or a wind turbine
I have been reading the docs and experimenting with a lot of different options but I can't get it done.
The graph:
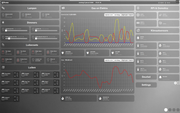
Note: It's an older screenshot where the graph does not have a legend. But you can see the blue line on the bottom of the graph. Which I would like to suppress or remove.
The part defining the graph in CONFIG.js:
Code: Select all
blocks[grafiek_elektra] = {}
blocks[grafiek_elektra]['title'] = 'Elektriciteit';
blocks[grafiek_elektra]['width'] = 12;
blocks[grafiek_elektra]['height'] = '400px';
//blocks[grafiek_elektra]['graph'] = 'bar';
blocks[grafiek_elektra]['legend'] = {'v': 'Laag', 'v2': 'Hoog'}
blocks[grafiek_elektra]['graphtypes'] = ['v', 'v2']; <= THIS DOESN'T WORK :(
blocks[grafiek_elektra]['pointFillColors'] = ['#aaa9a9', '#7e7e7e'];
blocks[grafiek_elektra]['pointSize'] = 3;
blocks[grafiek_elektra]['lineColors'] = ['#aaa9a9', '#7e7e7e'];Greetz,
Sjonnie
EDIT: Instead of graphtypes you should use graphTypes. Silly me