Dashticz - Show your dashboard and how-to's!
Moderators: leecollings, htilburgs, robgeerts
-
EdwinK

- Posts: 1820
- Joined: Sunday 22 January 2017 21:46
- Target OS: Raspberry Pi / ODroid
- Domoticz version: BETA
- Location: Rhoon
- Contact:
Re: Dashticz - Show your dashboard and how-to's!
Going to try this in the weekend. Too hot now
Running latest BETA on a Pi-3 | Toon® Thermostat (rooted) | Hue | Tuya | IKEA tradfri | Dashticz V3 on Lenovo Huawei Tablet | Conbee
Re: Dashticz - Show your dashboard and how-to's!
bad time scale in my dahsticz graph. Is this updated in the latest version?
Also, support for Virtual Sensor -> Electric (instant+Counter) seems buggy.

Also, support for Virtual Sensor -> Electric (instant+Counter) seems buggy.
-
Lokonli
- Posts: 2292
- Joined: Monday 29 August 2016 22:40
- Target OS: Raspberry Pi / ODroid
- Domoticz version:
- Contact:
Re: Dashticz - Show your dashboard and how-to's!
In the latest version there is no update on the time scale. What would you like to see?renerene wrote: Thursday 25 July 2019 7:41 bad time scale in my dahsticz graph. Is this updated in the latest version?
Also, support for Virtual Sensor -> Electric (instant+Counter) seems buggy.
For the Virtual Sensor-> Electric:
What is the current behavior?
What should the behavior be?
Re: Dashticz - Show your dashboard and how-to's!
Time scale should go to 15 min back from present time, max.
Latest point on time scale should be the same for all graphs
Make the electric senssor with bar graphs en seperate lines possisble, just luke temp, barometer
And 4) 'laatste uren' does not work
(5 in domoticz days are one day ahead in the weekly graph, bug, wed=thu, etc)
Latest point on time scale should be the same for all graphs
Make the electric senssor with bar graphs en seperate lines possisble, just luke temp, barometer
And 4) 'laatste uren' does not work
(5 in domoticz days are one day ahead in the weekly graph, bug, wed=thu, etc)
-
Lokonli
- Posts: 2292
- Joined: Monday 29 August 2016 22:40
- Target OS: Raspberry Pi / ODroid
- Domoticz version:
- Contact:
Re: Dashticz - Show your dashboard and how-to's!
Dashticz reports some graph data in bins of one hour (energy, gas).renerene wrote: Thursday 25 July 2019 19:10 Time scale should go to 15 min back from present time, max.
Latest point on time scale should be the same for all graphs
Make the electric senssor with bar graphs en seperate lines possisble, just luke temp, barometer
And 4) 'laatste uren' does not work
(5 in domoticz days are one day ahead in the weekly graph, bug, wed=thu, etc)
For other data the actual value is reported (power).
This explains the difference in the x-max values.
In your example for zonnepaneel probably the energy in the last hour is reported, not the actual power. This can be fixed.
Preferably it would be possible to combine a bar and line graph. Unfortunately the graph library that is used by Dashticz (morris.js) doesn't support that.
I'm considering to switch to Chart.js.
-
hilliamonks
- Posts: 2
- Joined: Saturday 27 July 2019 12:57
- Target OS: Linux
- Domoticz version:
- Contact:
Re: Dashticz - Show your dashboard and how-to's!
This is what you do:
1. Create a new chrome.exe shortcut
2. Change the path of the shortcut to: "C:\Program Files\Google\Chrome\Application\chrome.exe" --chrome --kiosk http://<ip-address>:8080/dashboard/index.html --incognito --disable-pinch --overscroll-history-navigation=0
3. Drag the shortcut into the startup folder so it loads automatically: C:\ProgramData\Microsoft\Windows\Start Menu\Programs\Startup https://scrabblewordfinder.vip/ https://www.applock.ooo/ https://www.7zip.vip/
Make sure you change the path to chrome.exe is correct. Same for the URL.
Last edited by hilliamonks on Monday 29 July 2019 22:01, edited 1 time in total.
-
Derik
- Posts: 1605
- Joined: Friday 18 October 2013 23:33
- Target OS: Raspberry Pi / ODroid
- Domoticz version: BETA
- Location: Arnhem/Nijmegen Nederland
- Contact:
Re: Dashticz - Show your dashboard and how-to's!
Just back from holiday...Lokonli wrote: Wednesday 24 July 2019 22:28Can you try the latest v3 beta:
https://github.com/dashticzv3/dashticz_v3/tree/beta
For documentation see:
https://dashticz-v3.readthedocs.io/en/b ... tml#graphs
@lokonli...
Just see there is a V3 ...
Can i use all the other settings from V2?
Or do i need to change a lot or are there bugs??
If there is no compaible problem i will the V3 a try...?
Just the same way like always? [ hold the config file and replacye the rest? ]
Xu4: Beta Extreme antenna RFXcomE,WU Fi Ping ip P1 Gen5 PVOutput Harmony HUE SolarmanPv OTG Winddelen Alive ESP Buienradar MySensors WOL Winddelen counting RPi: Beta SMAspot RFlinkTest Domoticz ...Different backups
-
Lokonli
- Posts: 2292
- Joined: Monday 29 August 2016 22:40
- Target OS: Raspberry Pi / ODroid
- Domoticz version:
- Contact:
Re: Dashticz - Show your dashboard and how-to's!
Yes, that should work.Derik wrote: Monday 29 July 2019 20:23Just back from holiday...Lokonli wrote: Wednesday 24 July 2019 22:28Can you try the latest v3 beta:Derik wrote: Wednesday 24 July 2019 13:40
Will you let here know when you do this?
And how to use and set this graphs...
THANKS
https://github.com/dashticzv3/dashticz_v3/tree/beta
For documentation see:
https://dashticz-v3.readthedocs.io/en/b ... tml#graphs
@lokonli...
Just see there is a V3 ...
Can i use all the other settings from V2?
Or do i need to change a lot or are there bugs??
If there is no compaible problem i will the V3 a try...?
Just the same way like always? [ hold the config file and replacye the rest? ]
Currently v3 contains only limited additional functionality compared to v2.
See the release notes:
https://dashticz-v3.readthedocs.io/en/b ... notes.html
and installation instructions:
https://dashticz-v3.readthedocs.io/en/b ... ation.html
-
Derik
- Posts: 1605
- Joined: Friday 18 October 2013 23:33
- Target OS: Raspberry Pi / ODroid
- Domoticz version: BETA
- Location: Arnhem/Nijmegen Nederland
- Contact:
Re: Dashticz - Show your dashboard and how-to's!
Lokonli
Looks working great..!!
I do have 1 graph working[ need more time ]
Are there more great options in the V3?
Looks working great..!!
I do have 1 graph working[ need more time ]
Are there more great options in the V3?
Xu4: Beta Extreme antenna RFXcomE,WU Fi Ping ip P1 Gen5 PVOutput Harmony HUE SolarmanPv OTG Winddelen Alive ESP Buienradar MySensors WOL Winddelen counting RPi: Beta SMAspot RFlinkTest Domoticz ...Different backups
-
Lokonli
- Posts: 2292
- Joined: Monday 29 August 2016 22:40
- Target OS: Raspberry Pi / ODroid
- Domoticz version:
- Contact:
Re: Dashticz - Show your dashboard and how-to's!
I try to document in the release notes:Derik wrote: Wednesday 31 July 2019 10:16 Lokonli
Looks working great..!!
I do have 1 graph working[ need more time ]
Are there more great options in the V3?
https://dashticz-v3.readthedocs.io/en/b ... notes.html
-
Derik
- Posts: 1605
- Joined: Friday 18 October 2013 23:33
- Target OS: Raspberry Pi / ODroid
- Domoticz version: BETA
- Location: Arnhem/Nijmegen Nederland
- Contact:
Re: Dashticz - Show your dashboard and how-to's!
Lokonli..
Nice work!!!
Perhaps week option in graphs?
And a option the shrink the numbers behind the, [ now i have 25,000000009 in a collum in the graph ]
Cannot get the multiple graph to work
I cannot understand where to place the 2 idx that i want to use...
This?;
Example how to use this?
Please a option to remove or adjust the great bar where the station name is displayed....
Cannot get to work the train routes..
Like to try nijmegen centraal to limburg centraal..
Perhaps a example?
Nice work!!!
Perhaps week option in graphs?
And a option the shrink the numbers behind the, [ now i have 25,000000009 in a collum in the graph ]
Cannot get the multiple graph to work
I cannot understand where to place the 2 idx that i want to use...
This?;
Code: Select all
graphTypes: ['te', 'hu']Code: Select all
3.0.2 (19-7-2019)

Main changes:

        New block parameters (textOn, textOff, imageOn, imageOff, iconOn, iconOff) to control the display of block text, icons and images depending on the device state.
Please a option to remove or adjust the great bar where the station name is displayed....
Cannot get to work the train routes..
Like to try nijmegen centraal to limburg centraal..
Perhaps a example?
Xu4: Beta Extreme antenna RFXcomE,WU Fi Ping ip P1 Gen5 PVOutput Harmony HUE SolarmanPv OTG Winddelen Alive ESP Buienradar MySensors WOL Winddelen counting RPi: Beta SMAspot RFlinkTest Domoticz ...Different backups
-
Lokonli
- Posts: 2292
- Joined: Monday 29 August 2016 22:40
- Target OS: Raspberry Pi / ODroid
- Domoticz version:
- Contact:
Re: Dashticz - Show your dashboard and how-to's!
I'm preparing a big upgrade of the graph module. After that the graph configuration parameters will be different. It will take a few days. Better wait for that.Derik wrote: Wednesday 31 July 2019 20:22 Lokonli..
Nice work!!!
Perhaps week option in graphs?
And a option the shrink the numbers behind the, [ now i have 25,000000009 in a collum in the graph ]
Cannot get the multiple graph to work
I cannot understand where to place the 2 idx that i want to use...
This?;Example how to use this?Code: Select all
graphTypes: ['te', 'hu']Code: Select all
3.0.2 (19-7-2019)

Main changes:

        New block parameters (textOn, textOff, imageOn, imageOff, iconOn, iconOff) to control the display of block text, icons and images depending on the device state.
Please a option to remove or adjust the great bar where the station name is displayed....
Cannot get to work the train routes..
Like to try nijmegen centraal to limburg centraal..
Perhaps a example?
Example for the new block parameters:
Code: Select all
blocks[4] = {
   textOn: 'Device 4 switched on',
   textOff: 'and off'
}
-
Derik
- Posts: 1605
- Joined: Friday 18 October 2013 23:33
- Target OS: Raspberry Pi / ODroid
- Domoticz version: BETA
- Location: Arnhem/Nijmegen Nederland
- Contact:
Re: Dashticz - Show your dashboard and how-to's!
i wait.... let me know when i can test...
Xu4: Beta Extreme antenna RFXcomE,WU Fi Ping ip P1 Gen5 PVOutput Harmony HUE SolarmanPv OTG Winddelen Alive ESP Buienradar MySensors WOL Winddelen counting RPi: Beta SMAspot RFlinkTest Domoticz ...Different backups
-
Derik
- Posts: 1605
- Joined: Friday 18 October 2013 23:33
- Target OS: Raspberry Pi / ODroid
- Domoticz version: BETA
- Location: Arnhem/Nijmegen Nederland
- Contact:
Re: Dashticz - Show your dashboard and how-to's!
when possible..[ i know feature request, only perhaps you are very smart ":-) ]
Make the popup simple adjustable.
Now they are for landscape tabs nice
i us a big portert tab, then is the popup useless..
Make the popup simple adjustable.
Now they are for landscape tabs nice
i us a big portert tab, then is the popup useless..
Xu4: Beta Extreme antenna RFXcomE,WU Fi Ping ip P1 Gen5 PVOutput Harmony HUE SolarmanPv OTG Winddelen Alive ESP Buienradar MySensors WOL Winddelen counting RPi: Beta SMAspot RFlinkTest Domoticz ...Different backups
-
Lokonli
- Posts: 2292
- Joined: Monday 29 August 2016 22:40
- Target OS: Raspberry Pi / ODroid
- Domoticz version:
- Contact:
Re: Dashticz - Show your dashboard and how-to's!
For the popup size, see:Derik wrote: Wednesday 31 July 2019 20:49 when possible..[ i know feature request, only perhaps you are very smart ":-) ]
Make the popup simple adjustable.
Now they are for landscape tabs nice
i us a big portert tab, then is the popup useless..
https://www.domoticz.com/forum/viewtopi ... th#p200034
That still should work ...
-
Gianni
- Posts: 230
- Joined: Saturday 21 July 2018 19:03
- Target OS: Raspberry Pi / ODroid
- Domoticz version:
- Location: Home@Belgium
- Contact:
Re: Dashticz - Show your dashboard and how-to's!
after 1 year i decide to mount my setup and install dashticz again.
now on V3 and mounted i decide to show my setup.
Its basic and need some css mod but it's a start.
now on V3 and mounted i decide to show my setup.
Its basic and need some css mod but it's a start.
- 67767207_1272790549591005_5170413658219479040_n.jpg (129 KiB) Viewed 2735 times
- 67768277_392896238246634_6558013593218973696_n.jpg (274.8 KiB) Viewed 2735 times
- 67621079_373660203298078_6072857897098805248_n.jpg (311.84 KiB) Viewed 2735 times
-
Gianni
- Posts: 230
- Joined: Saturday 21 July 2018 19:03
- Target OS: Raspberry Pi / ODroid
- Domoticz version:
- Location: Home@Belgium
- Contact:
Re: Dashticz - Show your dashboard and how-to's!
Looks like i can only post 3 image in 1 post
- 67881328_1341085666029368_4688343423655084032_n.jpg (239.19 KiB) Viewed 4648 times
- 67516435_707067386422288_7125101597306126336_n.jpg (250.2 KiB) Viewed 4648 times
- 67790086_556398594897570_6545765587736330240_n.jpg (265.96 KiB) Viewed 4648 times
-
Lokonli
- Posts: 2292
- Joined: Monday 29 August 2016 22:40
- Target OS: Raspberry Pi / ODroid
- Domoticz version:
- Contact:
Re: Dashticz - Show your dashboard and how-to's!
Nice 
I'm working on an update of the graph module. That will make the numbers on the y-axes look better.
I'm working on an update of the graph module. That will make the numbers on the y-axes look better.
-
RduPre
- Posts: 53
- Joined: Thursday 11 August 2016 18:41
- Target OS: Raspberry Pi / ODroid
- Domoticz version: beta
- Location: The Netherlands
- Contact:
Re: Dashticz - Show your dashboard and how-to's!
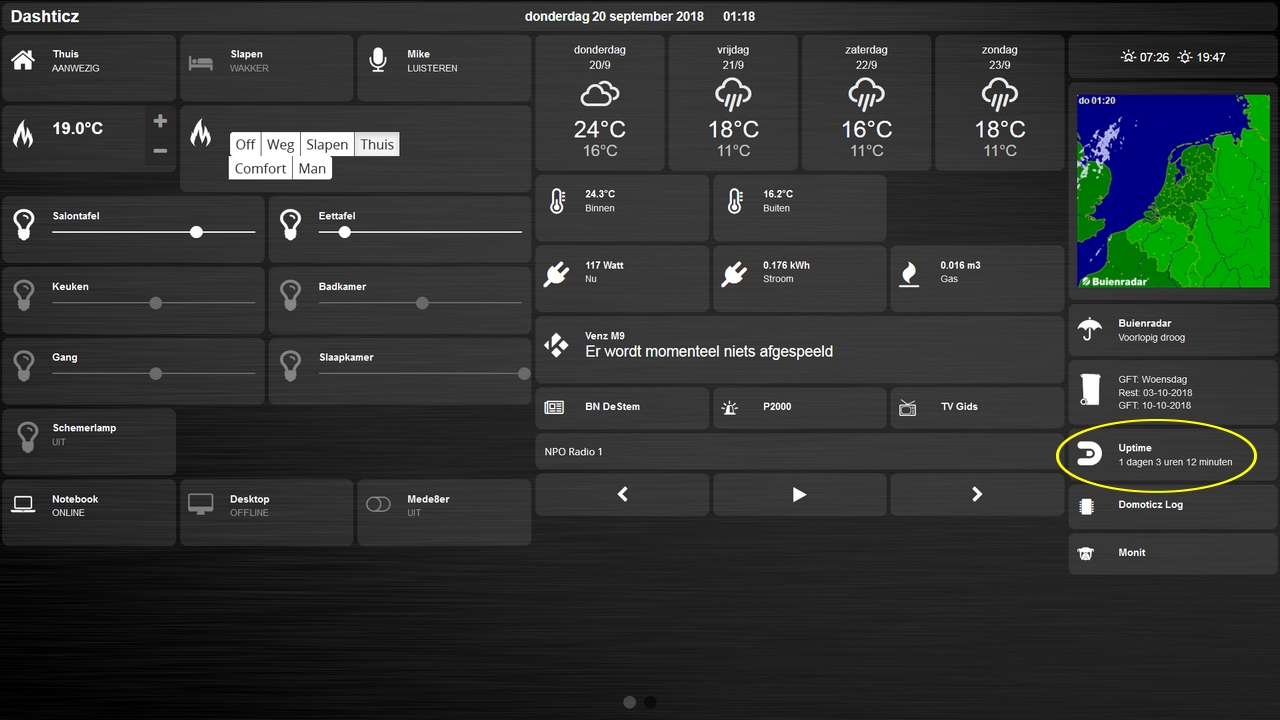
Hi,HansieNL wrote: Thursday 20 September 2018 0:48 I like the idea of having a button that shows how long Domoticz is up so I can use it in Dashticz.
I did find after trial and error some code that works...
 Because I'm no programmer there can be a better solution. Be so kind to let me know.
Code: Select all
-- script_time_uptime.lua -- -- Domoticz Configuration local server="192.168.1.11" -- Domoticz IP address local port="8080" -- Domoticz port local devname="Uptime" -- Dummy Text device name json = (loadfile "/home/pi/domoticz/scripts/lua/JSON.lua")() local gudata=assert(io.popen('curl "http://'..server..':'..port..'/json.htm?type=command¶m=getuptime"')) local guptime = gudata:read('*all') gudata:close() local jsonGetUptime = json:decode(guptime) local days = jsonGetUptime.days local hours = jsonGetUptime.hours local minutes = jsonGetUptime.minutes local dzuptime = days.. " dagen, " ..hours.. " uur en " ..minutes.. " minuten" commandArray = {} -- print('(Uptime) '.. dzuptime) commandArray ['UpdateDevice'] = otherdevices_idx[devname] .. '|0|' .. dzuptime return commandArray
Domoticz image:

I just started with Dashticz, so I might not read every detail yet.
But how do I add this to the screen, I only see a lua script and an image file in your post.
It would be great if you could share your config.js and custom.js.
Thanks Rien
-
HansieNL

- Posts: 969
- Joined: Monday 28 September 2015 15:13
- Target OS: Raspberry Pi / ODroid
- Domoticz version:
- Contact:
Re: Dashticz - Show your dashboard and how-to's!
I changed the script because a variable doesn't need a switch and is now supported in Dashticz.
You have 1st to create a string user variable Uptime in Domoticz. Save the script in the dzVents script map. Be sure that dzVents is enabled in Setup - Other Settings:
In Dashticz you can add a variable block:
Add the variable block to your Dashticz config like this:
You have 1st to create a string user variable Uptime in Domoticz. Save the script in the dzVents script map. Be sure that dzVents is enabled in Setup - Other Settings:
Code: Select all
-- dzuptime.lua
--
-- Set Domoticz Uptime as UserVariable
--
return {
    on = {   timer  =   {"every minute"}},

    execute = function(dz)
        local uptimeUserVariable = dz.variables("Uptime")

        local days    = dz.startTime.daysAgo
        local hours   = dz.startTime.hoursAgo%24
        local minutes = dz.startTime.minutesAgo%60

 	uptimeUserVariable.set(days .. " dagen, " .. hours .. " uur en " .. minutes .. " minuten")
    end
}
Code: Select all
blocks['v3'] = { //Uptime -- change v3 to your own variable and choose your own image
    title: 'Uptime',
	image: 'uptime.png',
	switch: true,
	width: 12
}
Code: Select all
columns[3]['blocks'] = ['sunrise',buttons.buienradar,345,'garbage','v3']
Blah blah blah
Who is online
Users browsing this forum: No registered users and 1 guest