Page 1 of 1
Graphing or extracting battery level time data
Posted: Thursday 14 May 2015 16:41
by mentar
I've not been able to figure out if graphing or extracting battery level time data is possible. Anyone know of it is, or how to get at the raw data with a JSON call?
Thanks
Re: Graphing or extracting battery level time data
Posted: Thursday 14 May 2015 16:56
by pvm
There's a wiki page on reporting low battery levels. That's the info you are looking for ?
Re: Graphing or extracting battery level time data
Posted: Friday 15 May 2015 14:23
by mentar
Thanks PVM, I am reporting the battery level without problems, but I can't see the history of the battery level. Ideally a graph just like the other output form the sensor. I have a solar powered sensor with a battery you see and want to be sure it's getting enough power during the day/night cycle.
Re: Graphing or extracting battery level time data
Posted: Sunday 17 May 2015 11:22
by sundberg84
Hi, this is exactly what im looking for - is this possible in Domoticz?
Battery-level-history-graphs/logs???
Re: Graphing or extracting battery level time data
Posted: Saturday 23 May 2015 10:42
by gizmocuz
No this is not implemented, and will probably also take a lot of database space todo this for every sensor.
If you really want it, you can install cacti
Re: Graphing or extracting battery level time data
Posted: Thursday 13 August 2015 21:18
by mfalkvidd
gizmocuz wrote:will probably also take a lot of database space todo this for every sensor.
It would be one value per sensor, which means that in worst case the storage is doubled (since the sensor probably is storing at least one value already, otherwise it wouldn't be much of a sensor).
Is that really such a big problem that it can't be implemented?
Re: Graphing or extracting battery level time data
Posted: Friday 28 August 2015 9:38
by sidepipe
Dunno if
viewtopic.php?f=24&t=6020 is any use to you. Essentially I created some scripts intended to be run from cron, which update sensors based on OpenZWave parameters... battery level is one example ( and THERMOSTAT OPERATING STATE another. ) For battery, you'd create dummy "Percent" sensors with a name which is the same as the name of the device you're monitoring with " Battery" on the end... I give examples of this.
The thing is ( and the only reason I come across this! ) is that mine's suddenly not updating any more, because the json URL to update the sensor simply isn't working. I've no idea why that might be, and may be just limited to mine, so you might want to give it a try.
Re: Graphing or extracting battery level time data
Posted: Friday 28 August 2015 10:04
by sidepipe
Hmm.. seems the reason mine had stopped working is that Domoticz had somehow messed up the virtual sensors - for some reason when I tried to update idx 179, it was actually updating one that had been automatically created at a different index. I deleted that, and the update created a new sensor at another new index ( then updated that. ) Bizarre. Anyhow - I deleted my sensors and re-added them and it's fine again - so these scripts should work fine. They only work with OpenZWave of course.
Re: Graphing or extracting battery level time data
Posted: Friday 28 August 2015 18:03
by Egregius
gizmocuz wrote:and will probably also take a lot of database space todo this for every sensor.
Maybe just adding a field to (for example) Temperature_Calendar table with the last battery level of that day? I guess one level a day is enough to see how long the batteries last in different appliances?
Re: Graphing or extracting battery level time data
Posted: Saturday 29 August 2015 12:37
by gizmocuz
Egregius wrote:gizmocuz wrote:and will probably also take a lot of database space todo this for every sensor.
Maybe just adding a field to (for example) Temperature_Calendar table with the last battery level of that day? I guess one level a day is enough to see how long the batteries last in different appliances?
for every device? its not just mysensors in domoticz here....
maybe, if you check the battery level at 13:00, and the next day also at 13:00 (or the next day at 13:00) you know how much percentage it will drop during one/two days?
Re: Graphing or extracting battery level time data
Posted: Saturday 29 August 2015 13:36
by Egregius
That could also be a solution for tracking battery usage.
I created some virtual percentage switches and fill the data with the batterylevels.
Re: Graphing or extracting battery level time data
Posted: Wednesday 02 September 2015 10:16
by AWI
Even better (in MySensors) is to report the battery level through a S_MULTIMETER type with V_VOLTAGE. This way it will show up like
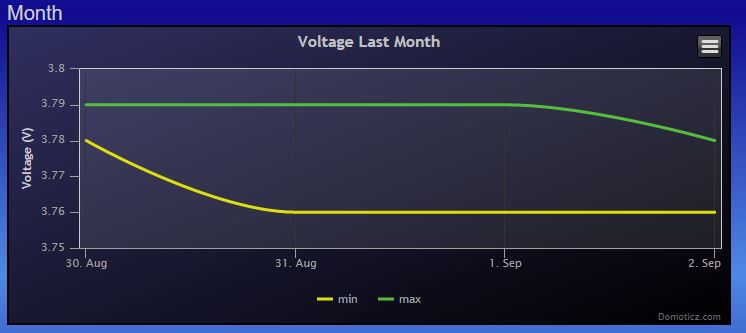
- Voltage.JPG (30.48 KiB) Viewed 3202 times
Re: Graphing or extracting battery level time data
Posted: Wednesday 29 June 2016 17:31
by insippo
How to i do this ?