Page 1 of 1

Strange values graphical log view

Posted: Tuesday 08 April 2025 9:18
by SunHopper
My smart meter P1 graphic logging showing some strange behavior.
When the power in/out comes around 500Watt both in and out come together and showing both higher values than 0Watt.
When this happens looking at the received data in the devices section one of the IN/OUT values is always 0 as it should be.
Looking in the domoticz database the same. Always one value is 0!
Version 2024.7 running on Ubuntu in a VM

Why is this happening?
Schermafbeelding 2025-04-08 091004.png
Schermafbeelding 2025-04-08 091004.png (159.46 KiB) Viewed 1789 times

Re: Strange values graphical log view

Posted: Tuesday 08 April 2025 12:58
by gizmocuz
How come you have a SDM630 (as I do as well) in a P1 graph? You should have kWh devices (if you use my modbus python plugin)
So who is creating this P1 device? Did you had a look at that code?

Re: Strange values graphical log view

Posted: Tuesday 08 April 2025 13:12
by SunHopper
@ gizmocuz I programmed a (my own arduino code) ESP8266 to convert the modbus protocol to a Json string and send it to Domoticz.
Have used this for a lot of years now but never seen this behavior of the graphical overview.
I think it happened after one of the last updates.

Re: Strange values graphical log view

Posted: Tuesday 08 April 2025 13:58
by SunHopper
@mark81
I send a json update every 10 seconds. Did change te update frequency to 1 minute but no difference. Tried print values to the log in the script_device_power2p1.lua script. But putting a print(value) line after line 19 "if (devicechanged[GRID_DEV]~=nil) then" the output is no longer visible in the log of Domoticz. I'm 100% sure one of in/out is always 0

Re: Strange values graphical log view

Posted: Tuesday 08 April 2025 14:04
by SunHopper
Here another example. Until 9.00 both in and out run parallel. Then in drops to 0 what it should be. It are not spikes as you can see.
IMG_1383.jpg
IMG_1383.jpg (68.57 KiB) Viewed 1739 times

Re: Strange values graphical log view

Posted: Tuesday 08 April 2025 14:06
by waltervl
If you download the csv file from the graph (from hamburger menu) do you see the same incorrect values as on the graph?
Also when using the API call (change IDX into valid value)?

Code: Select all

/json.htm?type=command&param=graph&sensor=counter&idx=IDX&range=day

Re: Strange values graphical log view

Posted: Tuesday 08 April 2025 14:15
by SunHopper
The database belonging to the last screenshot
Schermafbeelding 2025-04-08 141353.png
Schermafbeelding 2025-04-08 141353.png (37.54 KiB) Viewed 1735 times

Re: Strange values graphical log view

Posted: Tuesday 08 April 2025 14:16
by waltervl
waltervl wrote: Tuesday 08 April 2025 14:06 If you download the csv file from the graph (from hamburger menu) do you see the same incorrect values as on the graph?
Also when using the API call (change IDX into valid value)?

Code: Select all

/json.htm?type=command&param=graph&sensor=counter&idx=IDX&range=day
Repeat request...

Re: Strange values graphical log view

Posted: Tuesday 08 April 2025 14:30
by SunHopper
Schermafbeelding 2025-04-08 142413.png
Schermafbeelding 2025-04-08 142413.png (20.2 KiB) Viewed 1729 times
{
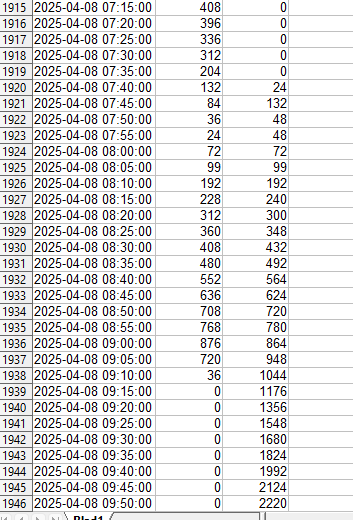
"d" : "2025-04-08 07:45",
"eg" : "448",
"eu" : "2568",
"r1" : "132",
"r2" : "0",
"v1" : "84",
"v2" : "0"
},
{
"d" : "2025-04-08 07:50",
"eg" : "452",
"eu" : "2571",
"r1" : "48",
"r2" : "0",
"v1" : "36",
"v2" : "0"
},
{
"d" : "2025-04-08 07:55",
"eg" : "456",
"eu" : "2573",
"r1" : "48",
"r2" : "0",
"v1" : "24",
"v2" : "0"
},
{
"d" : "2025-04-08 08:00",
"eg" : "462",
"eu" : "2579",
"r1" : "72",
"r2" : "0",
"v1" : "72",
"v2" : "0"
},
{
"d" : "2025-04-08 08:05",
"eg" : "471",
"eu" : "2588",
"r1" : "99",
"r2" : "0",
"v1" : "99",
"v2" : "0"
},
{
"d" : "2025-04-08 08:10",
"eg" : "487",
"eu" : "2604",
"r1" : "192",
"r2" : "0",
"v1" : "192",
"v2" : "0"
},
{
"d" : "2025-04-08 08:15",
"eg" : "507",
"eu" : "2623",
"r1" : "240",
"r2" : "0",
"v1" : "228",
"v2" : "0"
},
{
"d" : "2025-04-08 08:20",
"eg" : "532",
"eu" : "2649",
"r1" : "300",
"r2" : "0",
"v1" : "312",
"v2" : "0"
},
{
"d" : "2025-04-08 08:25",
"eg" : "561",
"eu" : "2679",
"r1" : "348",
"r2" : "0",
"v1" : "360",
"v2" : "0"
},
{
"d" : "2025-04-08 08:30",
"eg" : "597",
"eu" : "2713",
"r1" : "432",
"r2" : "0",
"v1" : "408",
"v2" : "0"
},
{
"d" : "2025-04-08 08:35",
"eg" : "638",
"eu" : "2753",
"r1" : "492",
"r2" : "0",
"v1" : "480",
"v2" : "0"
},
{
"d" : "2025-04-08 08:40",
"eg" : "685",
"eu" : "2799",
"r1" : "564",
"r2" : "0",
"v1" : "552",
"v2" : "0"
},
{
"d" : "2025-04-08 08:45",
"eg" : "737",
"eu" : "2852",
"r1" : "624",
"r2" : "0",
"v1" : "636",
"v2" : "0"
},
{
"d" : "2025-04-08 08:50",
"eg" : "797",
"eu" : "2911",
"r1" : "720",
"r2" : "0",
"v1" : "708",
"v2" : "0"
},
{
"d" : "2025-04-08 08:55",
"eg" : "862",
"eu" : "2975",
"r1" : "780",
"r2" : "0",
"v1" : "768",
"v2" : "0"
},
{
"d" : "2025-04-08 09:00",
"eg" : "934",
"eu" : "3048",
"r1" : "864",
"r2" : "0",
"v1" : "876",
"v2" : "0"
},
{
"d" : "2025-04-08 09:05",
"eg" : "1013",
"eu" : "3108",
"r1" : "948",
"r2" : "0",
"v1" : "720",
"v2" : "0"
},
{
"d" : "2025-04-08 09:10",
"eg" : "1100",
"eu" : "3111",
"r1" : "1044",
"r2" : "0",
"v1" : "36",
"v2" : "0"
},
{
"d" : "2025-04-08 09:15",
"eg" : "1198",
"eu" : "3111",
"r1" : "1176",
"r2" : "0",
"v1" : "0",
"v2" : "0"
},
{
"d" : "2025-04-08 09:20",
"eg" : "1311",
"eu" : "3111",
"r1" : "1356",
"r2" : "0",
"v1" : "0",
"v2" : "0"
},
{
"d" : "2025-04-08 09:25",
"eg" : "1440",
"eu" : "3111",
"r1" : "1548",
"r2" : "0",
"v1" : "0",
"v2" : "0"
},
{
"d" : "2025-04-08 09:30",
"eg" : "1580",
"eu" : "3111",
"r1" : "1680",
"r2" : "0",
"v1" : "0",
"v2" : "0"
},
{
"d" : "2025-04-08 09:35",
"eg" : "1732",
"eu" : "3111",
"r1" : "1824",
"r2" : "0",
"v1" : "0",
"v2" : "0"
},
{
"d" : "2025-04-08 09:40",
"eg" : "1898",
"eu" : "3111",
"r1" : "1992",
"r2" : "0",
"v1" : "0",
"v2" : "0"
},
{
"d" : "2025-04-08 09:45",
"eg" : "2075",
"eu" : "3111",
"r1" : "2124",
"r2" : "0",
"v1" : "0",
"v2" : "0"
},
{
"d" : "2025-04-08 09:50",
"eg" : "2260",
"eu" : "3111",
"r1" : "2220",
"r2" : "0",
"v1" : "0",
"v2" : "0"
},

Re: Strange values graphical log view

Posted: Tuesday 08 April 2025 14:32
by SunHopper
These values are not the same as in the database ! Where are these values stored?

Re: Strange values graphical log view

Posted: Tuesday 08 April 2025 16:06
by waltervl
SunHopper wrote: Tuesday 08 April 2025 14:32 These values are not the same as in the database ! Where are these values stored?
They are calculated by the Domoticz webui based on values from the database.....
Can you try this in an incignito/private browser session? Could be an issue with you cache....

Re: Strange values graphical log view

Posted: Tuesday 08 April 2025 16:36
by waltervl
You can try to switch to simple P1 view (no T1 and T2) if you have no difference in T1/T2 tariffs. You can do this in menu Setup, Settings, tab Meter/Counters.

There seems to be an issue in the code here where the data is sent from database to graphing system: https://github.com/domoticz/domoticz/bl ... h.cpp#L405