Page 1 of 1
P1 meter log display
Posted: Friday 12 July 2024 12:35
by yann500
Hello,
After updated my domoticz, I've seen that log display for P1 counter has changed. In usage last month graphic, I had usage 1 and usage 2 and now I have only total usage. Is it possible to change it?
Thanks in advance.
Yann
Re: P1 meter log display
Posted: Friday 12 July 2024 13:11
by janpep
Indeed. I liked it also with both slightly different colors on top of each other. And it would be nice if that was possible for all these bars.
Re: P1 meter log display
Posted: Thursday 08 August 2024 15:48
by yann500
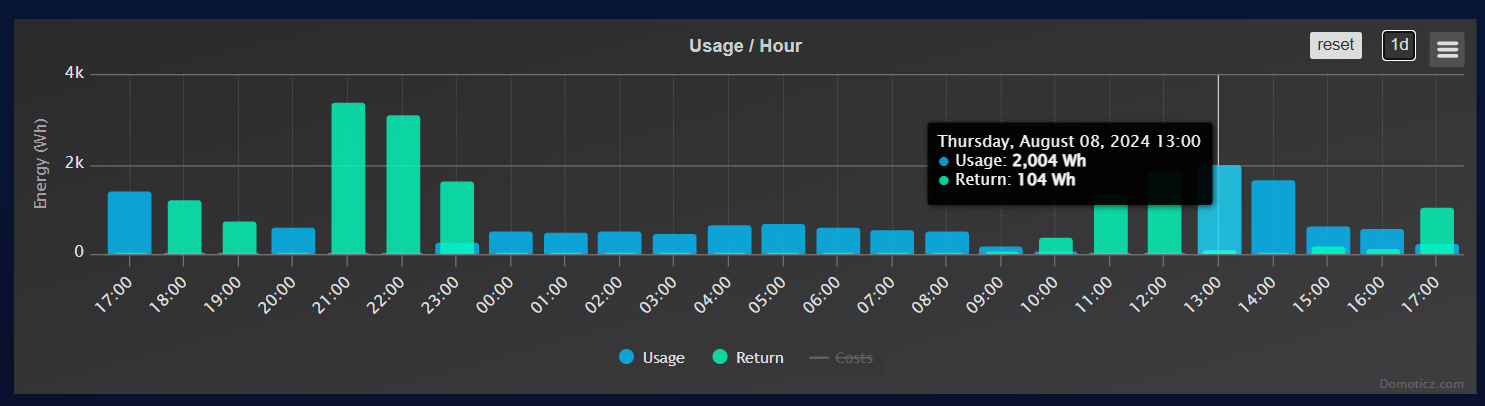
- linky.jpg (64.3 KiB) Viewed 1606 times
I would like to find this display.
Thanks
Re: P1 meter log display
Posted: Thursday 08 August 2024 17:34
by gizmocuz
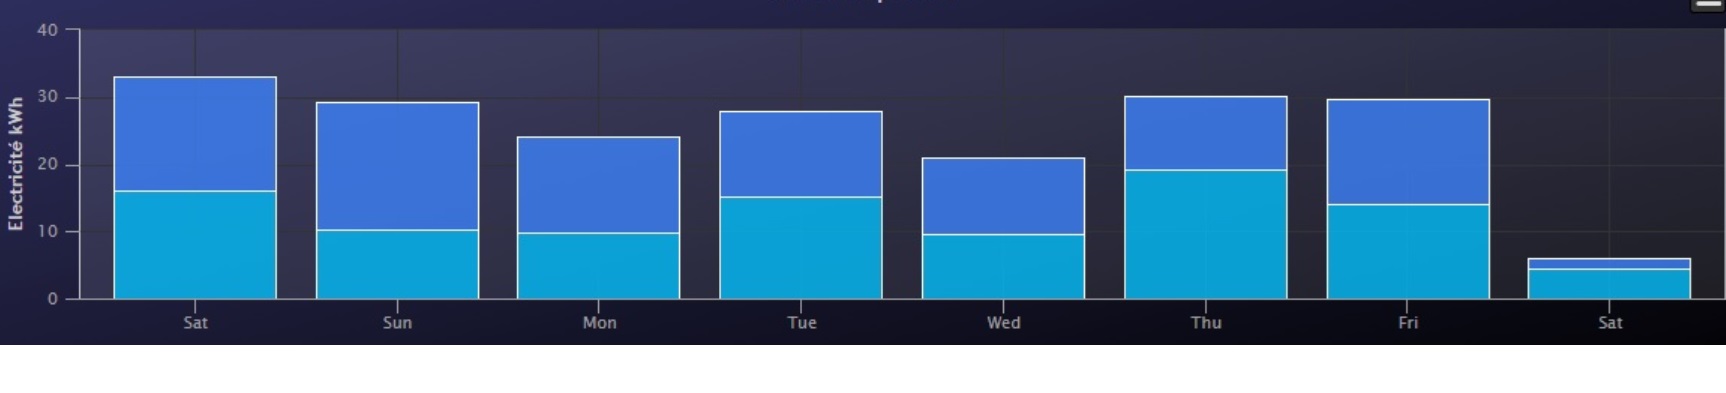
I find this view a way easier for the eyes:
- Clipboard_08-08-2024_01.png (146.42 KiB) Viewed 1590 times
- Clipboard_08-08-2024_02.png (146.01 KiB) Viewed 1590 times
Why do you always need to see the difference between T1/T2, by now you should know what your nightly usage is.
You can still see this when you go to the report view
Isn't it way more interesting to quickly see the actual usage?
Re: P1 meter log display
Posted: Thursday 08 August 2024 19:20
by janpep
gizmocuz wrote: ↑Thursday 08 August 2024 17:34
.... , by now you should know what your nightly usage is.
This is a
very strange argument. Then you can also say: "Skip the daily usage because by now you should know what your daily usage is. And we will also plan to skip the yearly usage. You should know by now."
Fact is that some people liked it the way it was. Their reason may vary and is actually unimportant.
Is it an idea to make it configurable in the settings?
Advantage that you can see the day and night rate ratio and the day to day difference at a glance.
Although less important, in the annual overview would it also be very nice to see how this ratio changes over the years. At a certain percentage it can become unattractive to have two counters. Now I calculate that from the annual overview of my energy company.
PS. I do not have solar panels. So no return.
Re: P1 meter log display
Posted: Friday 09 August 2024 12:46
by PierreT
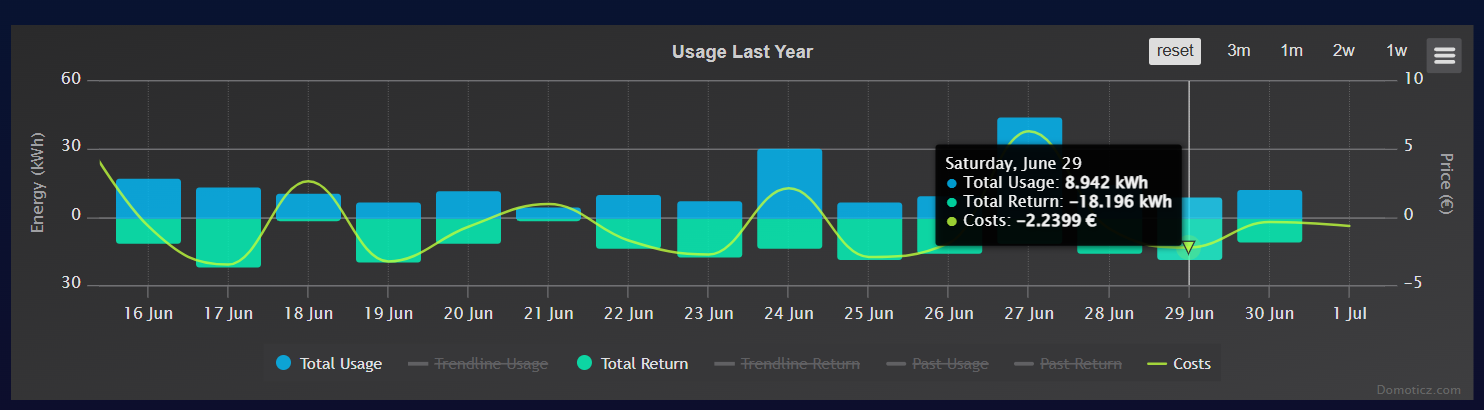
Seems to have been intended differently as settings allows you to choose between dual tariff and dynamic tariff. This setting does in fact work on the report page where it will show the two different shades of blue (and green if also delivering), however on the normal log page the week graph was removed completely and replaced with the dynamic pricing view which is essentially a bar graph copy of the last X days graph directly above it.
Re: P1 meter log display
Posted: Tuesday 13 August 2024 11:29
by gizmocuz
Correct, and there is a little button you can press '1w' to display just a week
This to be more consistent with the other graph overviews