Page 1 of 1
Custom Diagram
Posted: Wednesday 10 January 2024 13:55
by njlammerts
Is it possible to get a diagram with different sensors
in this example a diagram of the time a pump is running in relation of the temperature.
where they are synced in time
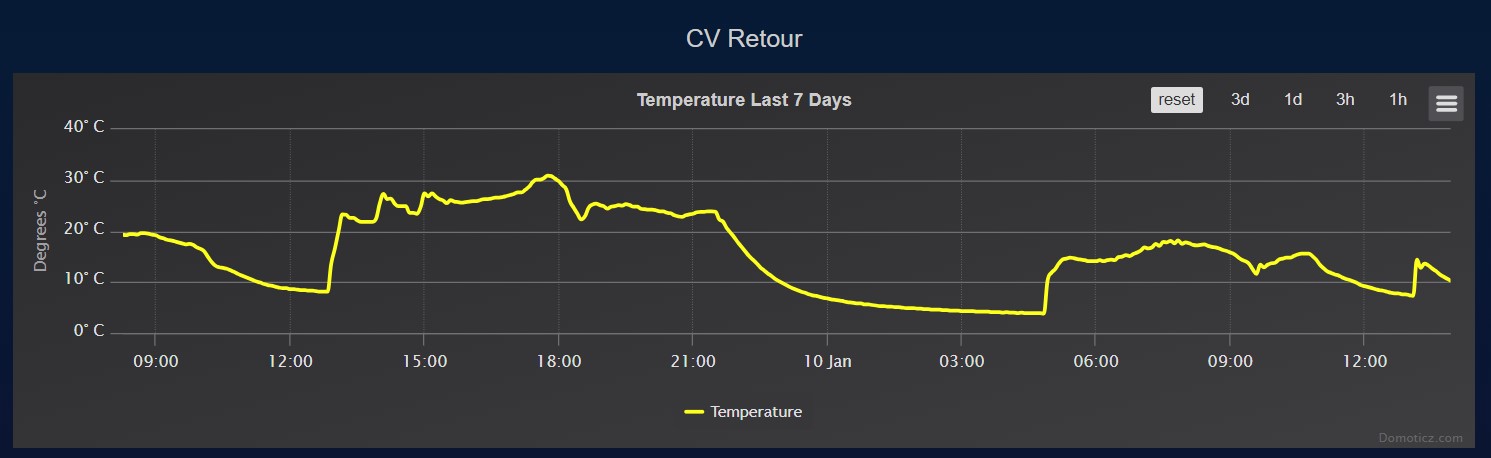
- Solar1.jpg (64.64 KiB) Viewed 3483 times
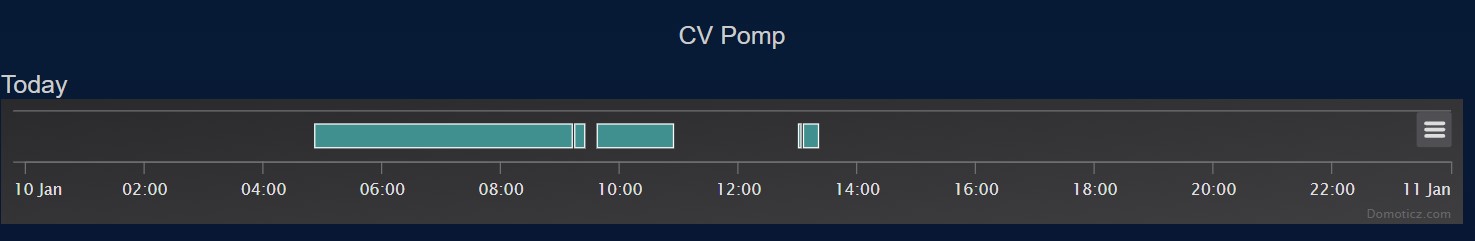
- Solar2.jpg (32.51 KiB) Viewed 3483 times
Re: Custom Diagram
Posted: Wednesday 10 January 2024 14:00
by waltervl
Not in Domoticz itself. With the Dashticz extension this is possible I think.
For example
https://dashticz.readthedocs.io/en/mast ... l#examples
Re: Custom Diagram
Posted: Wednesday 10 January 2024 15:23
by njlammerts
Thanks, i will look into that.
With Toya temperature sensors it is possible but that is probably possible due to fact there is 1 sensor selection where temperature, humidity and pressure is selectable as "weather station" but pressure 1 still a different diagram?
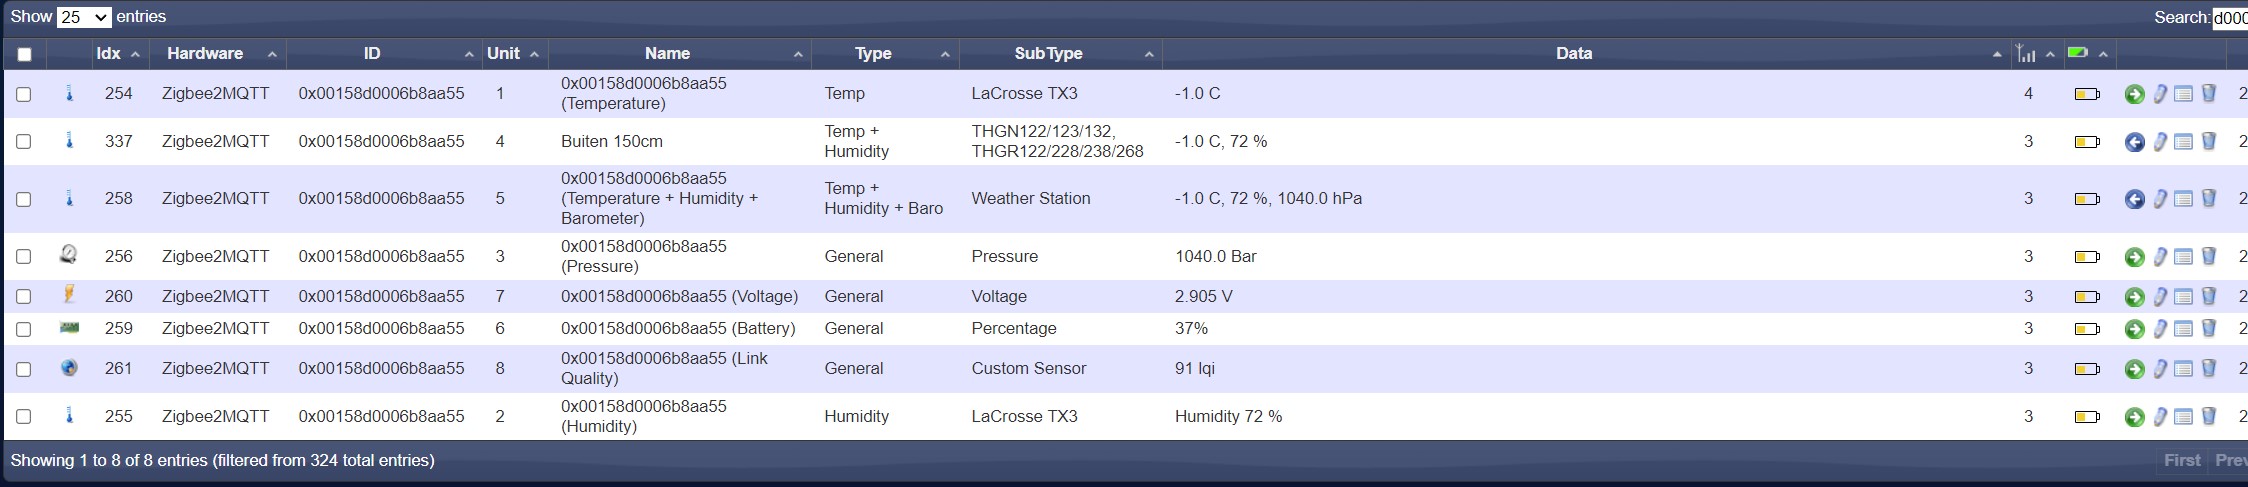
- Pic1.jpg (202.58 KiB) Viewed 3444 times
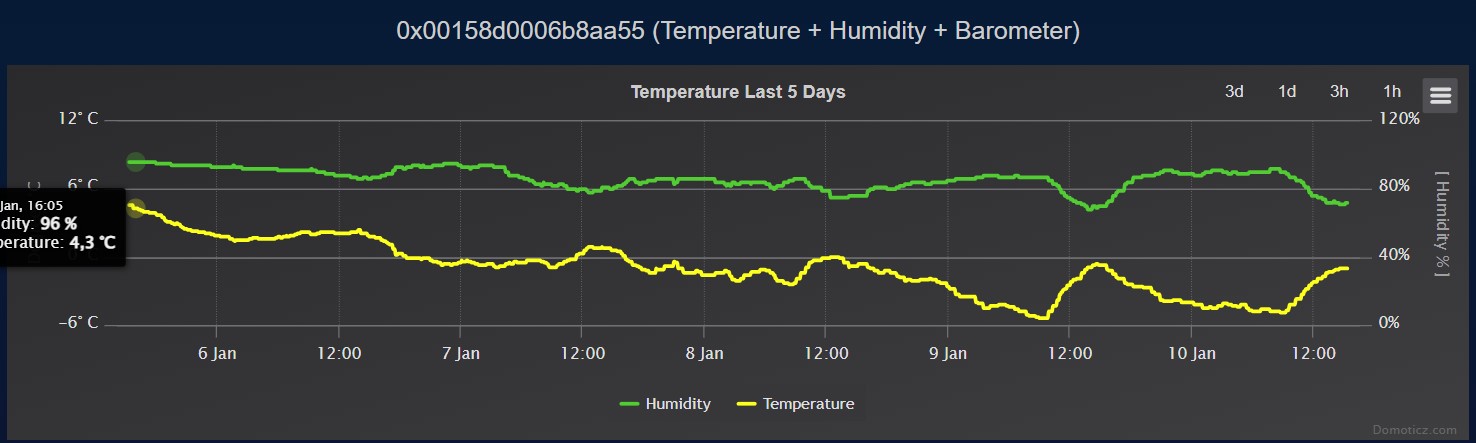
- Pic2.jpg (83.31 KiB) Viewed 3444 times
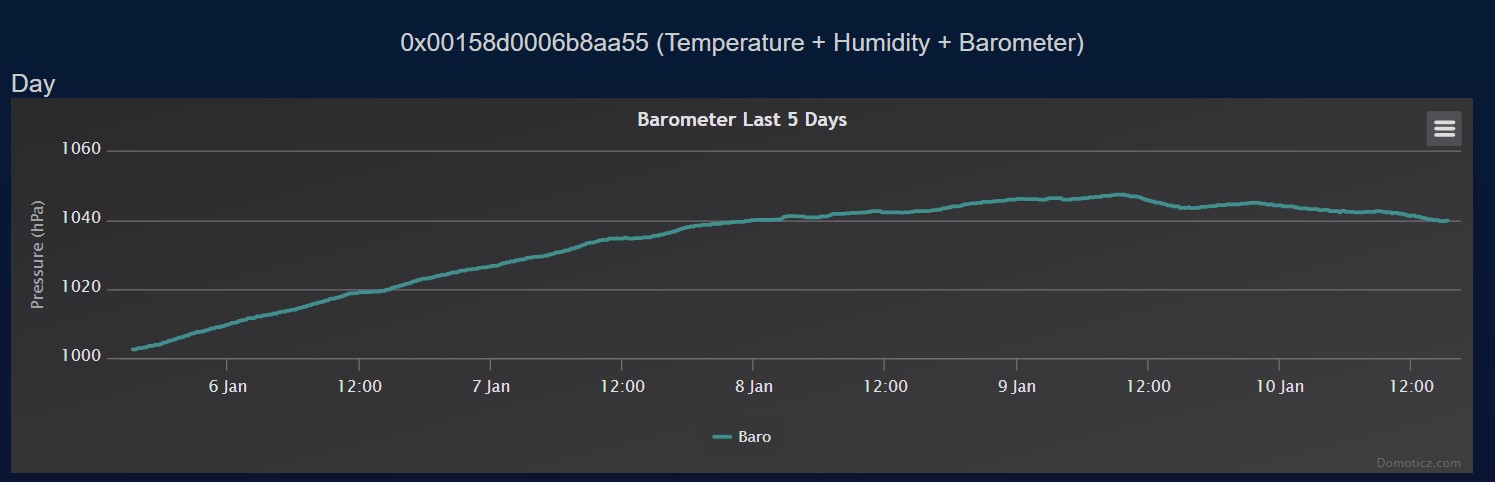
- Pic3.jpg (60.31 KiB) Viewed 3444 times
Re: Custom Diagram
Posted: Wednesday 10 January 2024 16:02
by waltervl
Some devices can show multiple values (eg Temp//Hum, Energy/Power). But there is no custom graph setting.
There is also the custom graph function for temperatures:
https://www.domoticz.com/wiki/Managing_ ... stom_Graph
But there is no standard function to combine "unrelated" values in a graph.
If you are a Javascript programmer the Domoticz community is happy to merge your future implementation for custom graphs

Re: Custom Diagram
Posted: Wednesday 10 January 2024 16:36
by njlammerts
thanks for the clarification. Unfortunately i am no programmer of any program language ;-(.
So i have to do it with the knowledge of this kind of Fora and copy/paste actions
