Page 1 of 1
Is there a limit to year graphics?
Posted: Sunday 13 August 2023 16:24
by Kedi
I have my Domoticz installed from 2015.
I wonder if there is a limit the the month 'Comparing Usage' graphics P1 smart meter widget.
Currently it fits nicely, but will Domoticz housekeeping keep all the years, and will the be displayed for ever, or is there a limit to it?
Re: Is there a limit to year graphics?
Posted: Wednesday 16 August 2023 17:36
by Kedi
Nobody with an answer?
Re: Is there a limit to year graphics?
Posted: Wednesday 16 August 2023 23:18
by waltervl
The one who implemented the compare chart is not on the forum, only on GitHub (michahagg). Looking at the code it does not seem to limit it.
Re: Is there a limit to year graphics?
Posted: Thursday 17 August 2023 9:50
by Kedi
Tnx.
Re: Is there a limit to year graphics?
Posted: Friday 18 August 2023 13:00
by gizmocuz
Domoticz will never remove day values from the database.
Maybe we should limit the compare chart in the feature as you don't want to see 20 years in the chart
Re: Is there a limit to year graphics?
Posted: Monday 28 August 2023 14:25
by BartSr
I would leave deleting records to the users.
Re: Is there a limit to year graphics?
Posted: Monday 28 August 2023 14:43
by waltervl
Not showing is not the same as deleting.....
Re: Is there a limit to year graphics?
Posted: Thursday 13 June 2024 17:41
by Hansbit
Is it possible to show an extra chart, for both P1 gas and electricity charts, just showing the total year usage per year?
When choosing a new energy supplier, for price comparison, I have to submit the gas and electricity on yearly basis. Now I have to add up all 12 month manually...
And it will also be nice to see if any energy saving measures take effect over years.
Re: Is there a limit to year graphics?
Posted: Thursday 13 June 2024 18:03
by HvdW
What you can do.
Go Setup -> Settings -> Backup/Restore
Do a backup.
Note the IDX of Power and Gas
Install and open DB Browser (SQL)
Open your backup
Go tab Browse Data (Gegevensbrowser)
Scroll Table (starting with applications)
Choose Multimeter calendar
set filter to the idx of your P1
Choose the dates you nee like 01/01/2023 and 31/12/2023 and copy fields Counter1, Counter2, Counter3,Counter4, Date
Paste it in a spreadsheet and off you go.
Code: Select all
Dal gebruik	Dal terug	Piek gebruik	Piek terug
29907340	10779111	16001275	25861618	2023-07-05
27797678	9464948		14731310	23015900	2022-07-05
2109662		1314163		1269965		2845718
Divide by 1000 and truncate to get kWh
Best option right now seems to be Vattenfall
PS Sorry for the amount of off topic here.
Re: Is there a limit to year graphics?
Posted: Thursday 13 June 2024 23:41
by waltervl
Hansbit wrote: Thursday 13 June 2024 17:41
Is it possible to show an extra chart, for both P1 gas and electricity charts, just showing the
total year usage per year?
When choosing a new energy supplier, for price comparison, I have to submit the gas and electricity on yearly basis. Now I have to add up all 12 month manually...
And it will also be nice to see if any energy saving measures take effect over years.
Why in a chart? Just go to the P1 Electricity report page or the P1 Gas report page (device Log -> Report) and you see everyting per year.....
https://www.domoticz.com/wiki/Managing_ ... ice_Report
You can also set the compare chart (last chart) to year display and it will show the logged results per year (and not default by month).
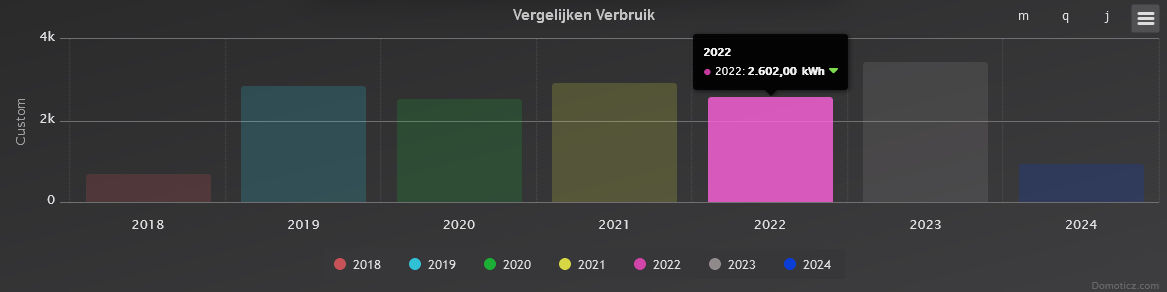
- Schermafbeelding 2024-06-14 001650.png (35.92 KiB) Viewed 1734 times
Re: Is there a limit to year graphics?
Posted: Friday 14 June 2024 9:28
by gizmocuz
If I look at my P1 graph, there is a limit of 10 years. I do not see data before that
Re: Is there a limit to year graphics?
Posted: Friday 14 June 2024 14:32
by Hansbit
waltervl wrote: Thursday 13 June 2024 23:41
...
You can also set the compare chart (last chart) to year display and it will show the logged results per year (and not default by month).
Schermafbeelding 2024-06-14 001650.png
Found it! Overlooked clicking on 'y' for years. Thanks!!