Page 1 of 1
Offset in Graph with counter data
Posted: Thursday 13 October 2022 15:38
by brjhaverkamp
Hello all,
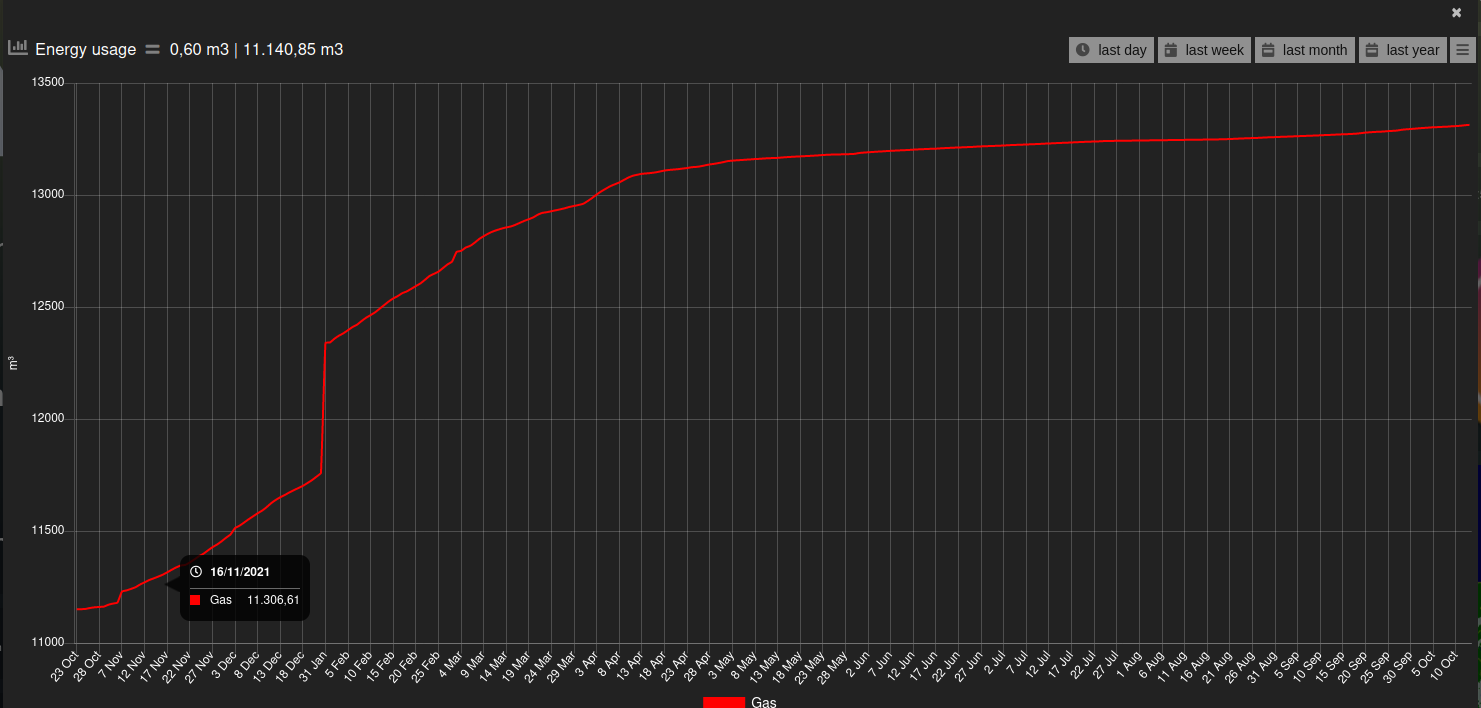
I am trying to make a graph with my yearly gas usage, measured with a P1 device.
The last snag is that I want to subtract the c value of last year.
I checked and I can subtract a constant value from the graph.
data: {
G: 'd.c_3-11140.85',
}
The value is available. It is in the title even: 11.140.85
But how can I access this in the graph definition?
The value is stored in the counter field of the device. Is it possible to use that in the calculation?
Kind regards,
Bert
- Screenshot from 2022-10-13 15-33-23.png (79.77 KiB) Viewed 595 times
Re: Offset in Graph with counter data
Posted: Sunday 23 October 2022 8:06
by brjhaverkamp
Hello all,
Sorry for bumping this question.

But it is the last remaining item on my list that I haven't been able to fix or circumvent in Dashticz.
Is there a way to get a counter or sensor value as a variable into the graph to subtract from the data?
I can do:
Code: Select all
     "last year": {
            range: 'year',
            filter: '12 months',
            data: {
                G: 'd.c_3-11152.95',
                E: 'd.c1_1-d.c3_1+d.c2_1-d.c4_1+301.98',
                L: 'd.c1_1-d.c3_1-1867.56',
                H: 'd.c2_1-d.c4_1+2183.53',
            },
            ylabels: ['m³ or kWh'],
        }
But I need the offset values to come from a variable.
Re: Offset in Graph with counter data
Posted: Thursday 27 October 2022 17:25
by brjhaverkamp
Hello all,
I assume based on the lack of replies till now, that there is currently no way to create the behavior I am looking for.
I opened a new issue for this in github.
https://github.com/Dashticz/dashticz/issues/1003
Maybe someone can find (or can point me) at a way to include this. it would make the graphs way more flexible.
Regards,
Bert
Re: Offset in Graph with counter data
Posted: Friday 28 October 2022 16:38
by Lokonli
ok, some undocumented feature...
You can access the Domoticz variable values with:
Code: Select all
Domoticz.getAllDevices()["v123"].Value
where 123 is the Domoticz variable ID that you want to use.
You can use this in your custom graph data as follows:
Code: Select all
E: 'd.c1_1-d.c3_1+d.c2_1-d.c4_1+Domoticz.getAllDevices()["v123"].Value',
Enjoy

Re: Offset in Graph with counter data
Posted: Saturday 29 October 2022 7:49
by brjhaverkamp
Hi Lokonli
Wow! I love undocumented features!! Thank you very much for your pointer. This was exactly what I was looking for.
With this tip, I was able to finish the graphs I was working on!
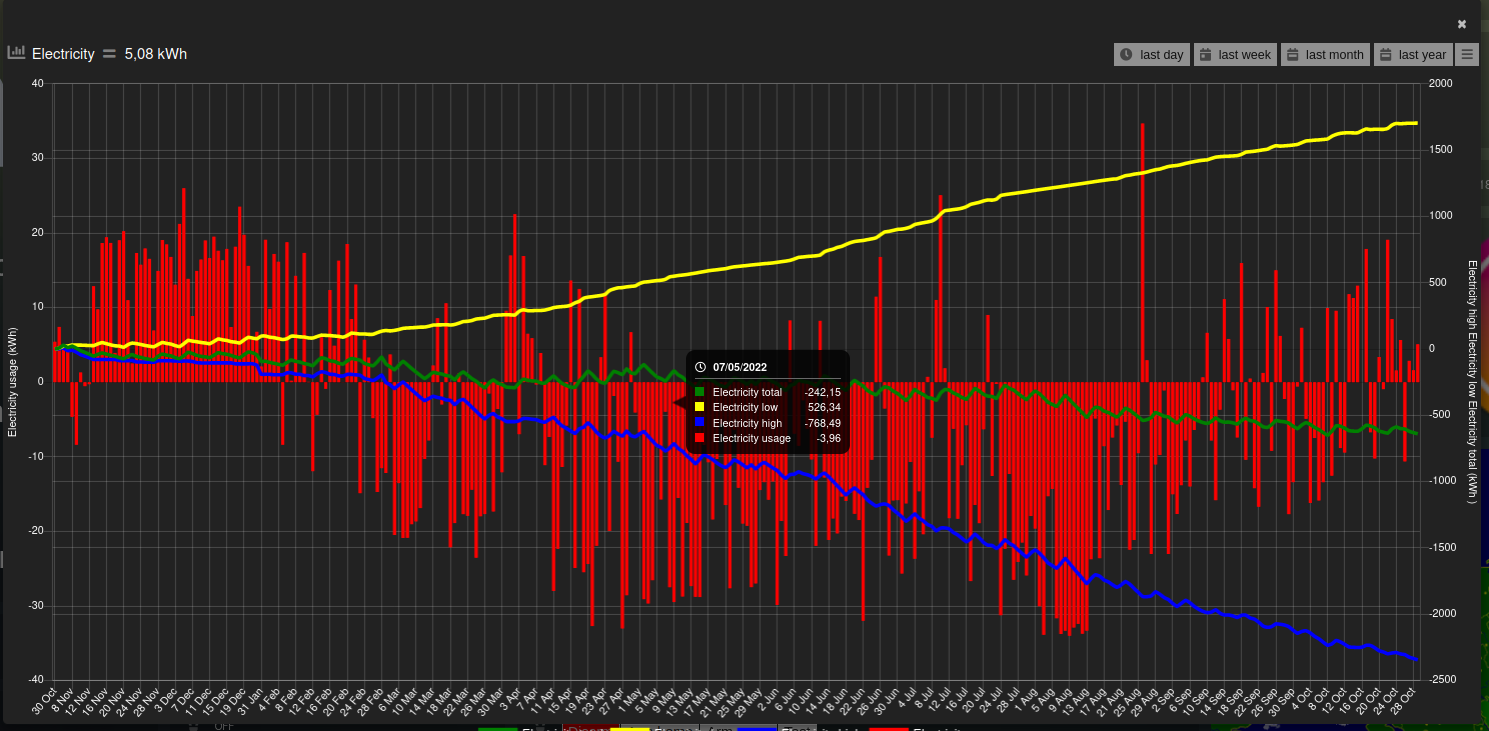
I can now plot my daily usage and the cumulative usage over 1 year.
In domoticz I created a dZvents script to collect last years usage in a couple of user variables. (One for low/night tariff and one for high/day tariff)
With your tip I subtract those values from the counter data of my p1 meter to get to the yearly view.
- Screenshot from 2022-10-29 07-41-53.png (226.53 KiB) Viewed 525 times
Shouldn't this be added to the documentation? Or is there a reason to leave this undocumented?
Bert