Page 1 of 1

Anyone help me make sense of my P1 data? Puzzled..

Posted: Thursday 26 August 2021 15:37
by ThirstyThursten
Hello,
So I have a P1 meter it's connected for a while it's working for a long time. Previous owner of this house made a RasPi with Domoticz and had a P1 USB cable and everything. Works great, when we bought the house I took over the Pi and data already there, all fine and such.
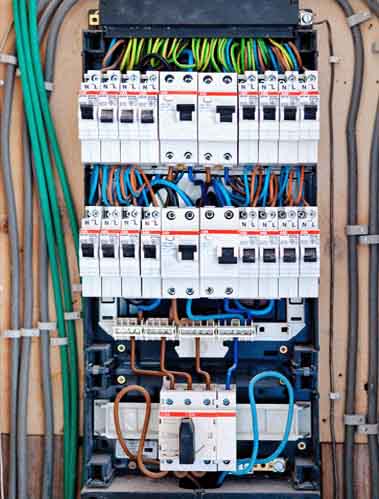
Then the electricien replaced our fuseboxes (meterkast in Dutch) cause it was outdated, and all the data in Domoticz from the P1 doesn't make sense anymore.. Electrician said he might have had to swap some wires (fases) because of the length.
I'll share some screenshots.
I would appreciate anyone who can help me figure out what is what! <3

I've been struggling with this for almost a year..
I'm looking to find out which one is what, like high-tariff, low-tariff, like which fase is which you know?

Don't pay too much attention to the naming, they are old and probably wrong.. Also not sure if the Maximum Relative Modulation Level is connected.. (Don't think so)
You can see in the Delivery-L1 and Delivery-L3 that the electrician swapped the wires (fases) when he replaced our fusebox end of October/Begin of November.
Usage-L1 and Usage-L3 show both different values in the overview. but in the Graphs I see a similar power draw somwhere around 12pm (that's consistent with the powering on of the oven for lunch). But why is it on both graphs, and why does Usage-L1 show more power earlier in the day, Usage-L3 is empty aside from the oven and why would Usage-L2 be only capped at 1Watt?
Is there anyway to find out what is connected to where, like physically in the house? (I'm an IT guy, don't know anything about fuseboxes and such.. :oops: )
Hope someone can help me make sense of this! :) I feel really dumb for not figuring this out..

Thanks in advance for helping out!
Greetz,
Thursten

Image

Image

Image

Image

Image

Image

Image

Image

Thanks in advance!

Re: Anyone help me make sense of my P1 data? Puzzled..

Posted: Thursday 26 August 2021 16:07
by waltervl
General info see https://www.domoticz.com/wiki/Dutch_DSM ... th_P1_port

Normally an electrician would spread all 220V groups over the 3 phases. you only can see physically in the groups box what groups are connected to what phases. You can take the covers off and follow the wires.
If you have a 3-phase electric furnice it is connected to all 3 phases but it could be that the oven is connected to another phase then the cooking plates. (I am dutch to so just translate literary :-) )
Your Solar panels are connected to phase 1 (delivery L1) and the used to be connected to phase 3 L3

The maximum relative modulation level is not part of the standard implementation.
What devices do you see in the device list (Setup-devices) if you filter on the P1 meter hardware? Use the extra filter option (left slide out bar) to filter on hardware.
https://www.domoticz.com/wiki/Setup_Dev ... ra_Filters

Re: Anyone help me make sense of my P1 data? Puzzled..

Posted: Thursday 26 August 2021 16:16
by waltervl
A groups box without covers. Can be viewed without real harm as long as you dont follw the wires with your finger :-)
Image

Re: Anyone help me make sense of my P1 data? Puzzled..

Posted: Thursday 26 August 2021 17:08
by ThirstyThursten
Hey @waltervl I appreciate it! And don't worry about th translations that's fine, I was struggeling with some of the terminology as well! :P

And yeah I tried to take off the covers before, I want to map it out someday but you know how that works, right.. "someday.." :P

Solar Return is Delivery-L1

These are the devices I got:
Devices.PNG
Devices.PNG (65.91 KiB) Viewed 992 times

Re: Anyone help me make sense of my P1 data? Puzzled..

Posted: Thursday 26 August 2021 17:24
by waltervl
So the modulator device is not part of the P1 slimme meter hardware.

To see what connects to what phase you could also take a mobile high power device like an electric water cooker, toaster, heater etc. and put it in a socket and see what phase shows a spike.

Re: Anyone help me make sense of my P1 data? Puzzled..

Posted: Thursday 26 August 2021 17:50
by AllesVanZelf
Easiest way is to power off 1 switch and walk through your house to make a note where there is no electricity ;) That is what I did.

Re: Anyone help me make sense of my P1 data? Puzzled..

Posted: Thursday 26 August 2021 18:39
by ThirstyThursten
@AllesVanZelf, yeah that was the plan! :)
But that still doesn't really explain the data I'm seeing.. I just want to know how I can correlate the phases of my P1 and the graphs I see above.. Cause isn't there also like a peak price and lower one? (Like day and night prices? Can't think of the proper english words.. xD )

Re: Anyone help me make sense of my P1 data? Puzzled..

Posted: Thursday 26 August 2021 19:22
by FireWizard
Hello @ThirstyThursten

If you look to your sensors in Domoticz, you will see a total overview and in addition you will find the Voltage for each phase. (Not visible)
(Voltage L1, Voltage L2 and Voltage L3, previously they used to call them Phase R, S and T)

If you have a single phase energy meter, you will only see L1.

You have a 3 phase system, so you have L1, L2 and L3

Without Solar Panels, you will only consume electricity from the grid, and so will only see Usage L1, Usage L2 and Usage L3.
The sensors for Delivery stay 0.

However, as you have your Solar Panels connected to a single phase Inverter, which is connected to phase L1, you will only see a delivery on Delivery L1.
Delivery L2 and L3 will stay 0.
With a 3-phase Inverter you would have seen deliveries on all 3 phases.

As @waltervl already said. Previously your Solar Panels have been connected to Phase L3, but are reconnected between November 2020 and January 2021.
The electrical engineer moved at least the Solar Panels from Phase 3 to Phase 1.
The chance is big that he also moved the connection from L3 to L1, and who knows also the other phase.

If you look to the picture the switchboard of @waltervl, you will see at the 3rd. row the main switch. You can easily separate the whole electrical installation from the grid, e.g. in case of fire or other emergency.

The 1st and 2nd row you will find 2 (totally 4) earth leakage circuit breakers (the wider one), each supplying 4 electricity groups.
The maximum allowable number of groups after a earth leakage circuit breaker is 4, so it is possible that you have less.
So this switchboard has 4 x 4 groups and 2 of the earth leakage circuit breakers are connected to the same phase.

Be aware that the total current consumption at any time in a group may not exceed 16 A and the total current consumption in a phase may not exceed
25 A. So totally a household has theoretically 75 A available.

As said the easiest way is to switch off every group and walk through your house and check which outlet or lamp is not functioning.

Another thing you will see in your graph is Usage 1, Usage 2, Return 1, Return 2.

On the first graph you see a dark blue (Usage 1) line ending at 07:00 in the morning. This line indicates the power consumption for the lower tariff (nachttarief). At 7 the standard tariff Usage 2 (normaal tarief of dag tarief) starts The same with Return 1 (dark green) This indicate, what you deliver to the grid during daytime. You do not deliver something during night time. In the weekend you pay the lower tariff during the whole day and get paid for the Return 1.
However the times that the lower tariff is active depends on the electricity supplier and your contract.

This Usage 1. Usage 2, Return 1 and Return 2 is only valid in The Netherlands. In Belgium it is mostly the other way around.

I hope this explains something of what you see.

Regards

Re: Anyone help me make sense of my P1 data? Puzzled..

Posted: Saturday 28 August 2021 18:58
by ThirstyThursten
@FireWizard, Holy cr*p on a cracker! Thank you so much for your long and detailed information and explanation! That makes a lot more sense of it! I widely appreciate you taking the time and effort to explain it! <3 Thanks man! :D

Greets!