Page 1 of 1
OpenWeatherMap data interpretation. Is it a forecast?
Posted: Saturday 07 August 2021 20:37
by amwr
Hi
I'm a bit confused what data I see from the OpenWeatherMap plugin.
I understand that there should be forcast data like: Day0 = today, Day1 = tomorrow, etc. However, if I look at the logs of these devices, I see hourly data from the past 3 days and the last entry is at the current time. So it looks like a regular sensor. But it's supposed to be a forecast, correct? So, how do I have to understand the data?
Thanks for help..
Re: OpenWeatherMap data interpretation. Is it a forecast?
Posted: Saturday 07 August 2021 22:45
by kiddigital
Not sure what you mean, maybe a few screenshots can help as examples.
But indeed all ‘forecast’ devices are just sensors and they are updated with new data every time.
So, for example the ‘Day 2 temperature’ sensor hold the expected maximum temperature for the day after tomorrow (Day 0 is today, Day 1 is tomorrow, etc.) as OWM predicts at the moment. After say an hour, OWM’s updated predictions might have a slightly different value for Day 2. The previous value will show up in the log data.
Tomorrow, the prediction for that particular day become predictions of Day 1 (as it then is only 1 day away). So updated predictions for that day will be in the ‘Day 1’ sensor and logging.
So you see that the logging is not really useful as the values keep pointing to continuous moving days.
Only the actual values of these sensors are useful and allow you to build a custom prediction dashboard, trigger action like signaling when to walk the dog, etc.
Does this clarify a bit?
Re: OpenWeatherMap data interpretation. Is it a forecast?
Posted: Sunday 08 August 2021 13:17
by amwr
Thank you for the explanation. This makes sense.
One question remains: If we look at the rain forecast for Day1, we can see the predicted amount of rain in mm. Does the current value (latest value) show the amount of rain for the whole day tomorrow or just for the hour of the current time + 24h? If it's the latter case, would I need to calculate the sum of Day2 values 00-24h of the previous complete day in order to get the total amount of rain for tomorrow?
Re: OpenWeatherMap data interpretation. Is it a forecast?
Posted: Monday 09 August 2021 7:32
by kiddigital
It gives the predicted total amount of rain for the whole day.
When you have the hourly forecasts activated, there will be 48 hours of forecasts per hour available (starting with hour 0 being the current hour and so on).
Re: OpenWeatherMap data interpretation. Is it a forecast?
Posted: Monday 09 August 2021 7:47
by amwr
I'm suprised: So this chart means that the forecast was changing quite a lot during the day (0.8 to 3.7mm/day).
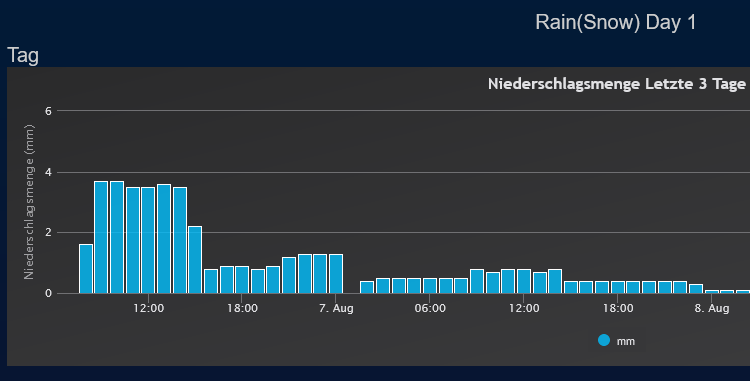
- day1.png (24.32 KiB) Viewed 1177 times
There's no rain forcasted in the next few days, so I will test this once the rainy summer weather is back..
Edit:
Maybe I don't have to wait. Let's have a look at Day5 where some evening thunderstorms are predicted:
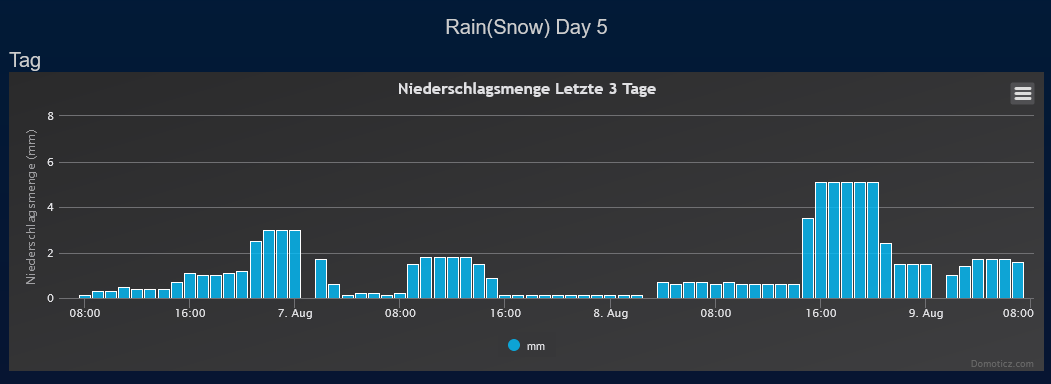
- day5.png (35.54 KiB) Viewed 1176 times
This is exactly the kind of data I would expect to describe an evening thunderstorm prediction. But if each hour would contain the whole amount of rain of the day, then I wonder why the prediction changed so much at around 15:00.
So, this suggests to me that in order to get the whole amount of rain for day5, I would need to sum up all hours of day5 instead of just using 1 data point?
Re: OpenWeatherMap data interpretation. Is it a forecast?
Posted: Monday 09 August 2021 7:59
by kiddigital
Forecasts can change as they are constantly (hourly or even more often) updated.
But remember that the graph of ‘Day 1’ is showing the forecasts of multiple actual days.
The 3 day ‘Day 1’ graph shows you forecast of 3 different days.
Day - 3 shows you the forecast (changes) for Day - 2
And Day - 2 in the graph shows forecasts for Day - 1
Example. Today is Monday.
The graph shows the last 3 days, so Friday, Saturday and Sunday.
When you look at the forecast values of Friday, they each represent the forecasted total amount of rain for Saturday.
But the Saturday values in the graph show the forecast for Sunday.
And Sunday show the forecast values for today (Monday)
The graph are not very useful as interpretation is not easy.
Are you looking for something special?
Re: OpenWeatherMap data interpretation. Is it a forecast?
Posted: Monday 09 August 2021 8:03
by amwr
I just edited my previous post in parallel. Please have a look at day5.
Anyway, I'll keep an eye on this topic. Thanks for your support!
Re: OpenWeatherMap data interpretation. Is it a forecast?
Posted: Monday 23 August 2021 14:13
by amwr
@kiddigital sorry to bother again, but I'm still confused what I'm seeing.
Current value is as shown here:
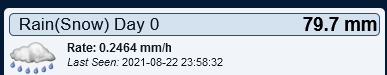
- Unbenanntes Bild.png (6.64 KiB) Viewed 1117 times
History is like this:
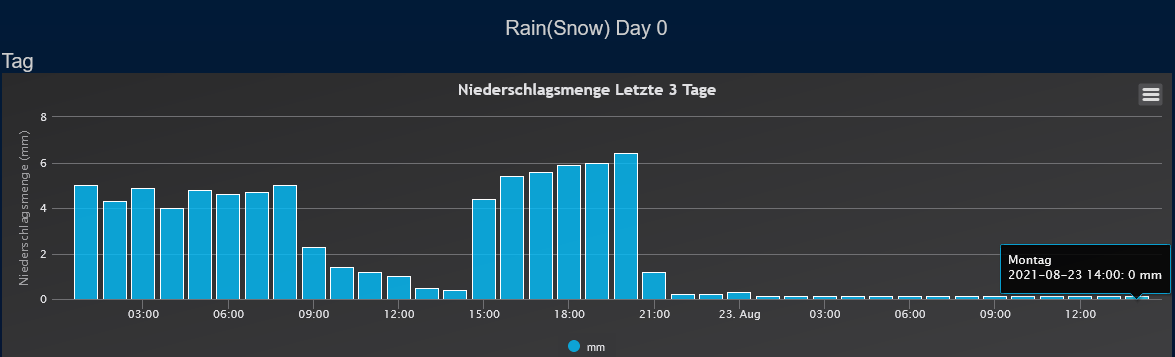
- Unbenanntes Bild1.png (34.61 KiB) Viewed 1117 times
Which one is the actual current value? 79.7mm or 0 (as shown in the history)?
I assume it's 0.
79.7 is probably the sum of something, which means it must be ignored?
Re: OpenWeatherMap data interpretation. Is it a forecast?
Posted: Tuesday 24 August 2021 11:46
by kiddigital
Hm... did a little deep dive in some of the Domoticz code on how it handles Rain sensors... and I think that it wasn't designed to handle forecast data

It is fine when you just use the actual sensor values representing the current predictions about a future moment. But looking at historical data/graphs on the predicted values, it becomes messy.
Assumption is that it receives actually measured rain/snow (Precipitation) that has fallen. Either as an increasing amount over a day or like a rate (mm/h). Based on these values it creates historical data, like how much rain has fallen in a certain hour in the past.
But when we provide a changing prediction for a whole day, could be high in the beginning but also lower a little later, it should not be processed in the same way.
And currently it does, which could be the reason behind the 'so far unexplainable' historical graphs on prediction data.
Once I have some more time, I will take a look and see if we have to add something to Domoticz to better handle 'future (predicted)' Rain.
Would be a nice feature (no clue yet how hard/impossible it is) if you can 'bind' predictions (sensors) to actual values (sensors) and show them in 1 single graph somehow... The hard part is that you will have multiple predictions on a single 'moment' (day, hour, etc.) and only a single real value... But let's have look