Page 2 of 2
Re: Bar charts of energy consumption
Posted: Monday 16 October 2023 21:25
by Daro1003
I ran the sudo git pull command and then restarted Domoticz.
1. Stop domoticz
2. Go to plugin folder and pull new version
cd domoticz/plugins/Tasmoticz
git pull
3. Start domoticz
4 sudo reboot
I removed the sensor and after a while it was added again without any changes:
Re: Bar charts of energy consumption
Posted: Tuesday 17 October 2023 2:29
by joba1
I miss the step where you switch to the test branch:
3. git checkout energy-totals-as-counters
...
edit:
and just in case you are not familiar with this: to go back to the main version you would do
git checkout master
Re: Bar charts of energy consumption
Posted: Tuesday 17 October 2023 20:21
by Daro1003
Can someone post instructions on how to update Tasmoticz to this test version?
Re: Bar charts of energy consumption
Posted: Tuesday 17 October 2023 23:26
by waltervl
0. Remove the incorrect sensor (from menu setup - devices)
1. Stop domoticz
2. Go to plugin folder and pull new version
cd domoticz/plugins/Tasmoticz
git pull
git checkout energy-totals-as-counters
3. Start domoticz
Re: Bar charts of energy consumption
Posted: Wednesday 18 October 2023 23:15
by Daro1003
Thank you.
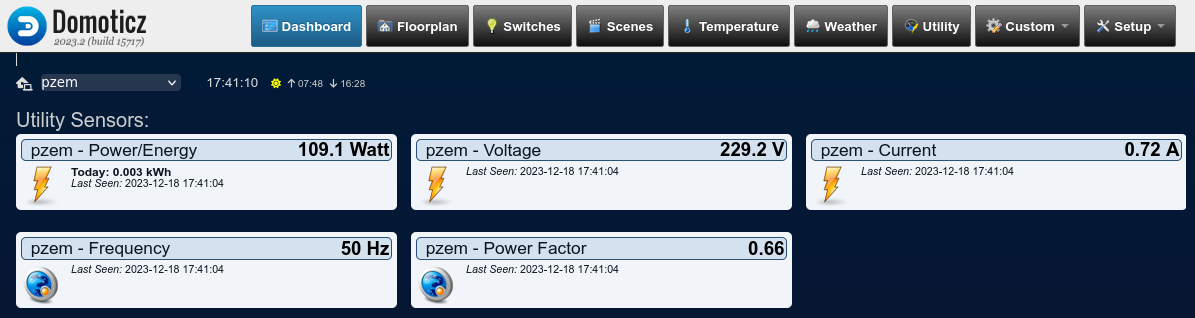
I followed the instructions for the effect in the attached photo.
Looks like it worked. Is this how it's supposed to look in Domoticz?+
Thank you all for your help and for taking me seriously even though I am not a specialist and do not know programming.
I will insert charts from domoticz and Dashticz.
P.S What does the number zero in the right corner mean in my case? Below is the indication of total consumption.
In Dashticz, two separate bars are displayed for one block from Domoticz. This can be confusing.
Is it possible to somehow change the description of these blocks into two different descriptions?
Re: Bar charts of energy consumption
Posted: Friday 20 October 2023 19:25
by Daro1003
On the desktop, dashticz is still a bar chart, why not a bar chart like in domoticz?
Re: Bar charts of energy consumption
Posted: Friday 03 November 2023 19:47
by joba1
Ok, some values should have come in by now to actually see charts.
Since I have never used these kind of sensors/bar charts before, it is hard to tell if they are ok.
Can anyone who has already used them manually before confirm the values/diagrams are as expected?
Then I would take the feature into the main branch for general use.
Thanks!
P.S: I don't know Dashticz, so can't comment on that...
Re: Bar charts of energy consumption
Posted: Thursday 21 December 2023 11:51
by psubiaco
Maybe you can
try the new PZEM plugin that permits to connect up to 51 PZEM meters to the same bus, using a cheap RS485/USB adapter or RS485/net/wifi module:
https://github.com/CreasolTech/domoticz-pzem-016
Actually it was tested with PZEM-004T, PZEM-014 and PZEM-016.
Device names can be translated in your preferred language: if you write here the translated device names and language code, I can add that language in the plugin.
Many thanks for any feedback / suggestion / translation !
- domoticz-pzem-016-screenshot1.png (59.64 KiB) Viewed 2475 times

- domoticz-pzem-016-hardware.png (71.65 KiB) Viewed 2475 times
Re: Bar charts of energy consumption
Posted: Monday 25 December 2023 21:36
by Daro1003
Friend @joba1, can you split this block in domoticz into two separate ones? Because in dashticz two blocks are shown but their name and order cannot be changed, only both blocks are under the same name because in domoticz there is one block. This block shows the total energy and the energy of yesterday. In the previous version there were two separate blocks in domoticz energy yesterday and total energy.
Please update the plugin.
Re: Bar charts of energy consumption
Posted: Monday 15 January 2024 13:09
by joba1
Tasmoticz only creates domoticz devices. How it is displayed is up to domoticz. If you know a device type / subtype that works better, I can use that.
I have not yet merged the pull request with the changed energy meter type because I see strange reports. Not sure what to do about it:
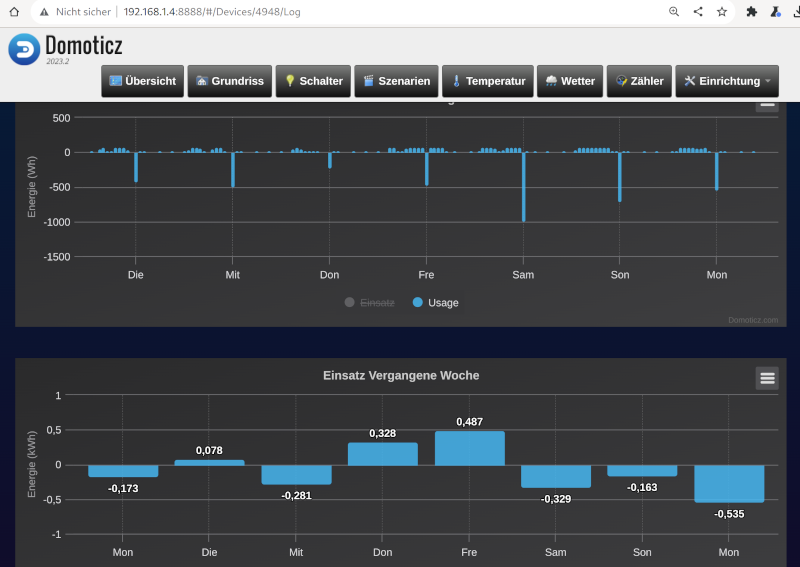
- domoticz-power-graph.png (128.56 KiB) Viewed 2060 times
I see positive and negative energy consumption bars in the 7 days hourly diagram (one big negative each day at 0:00, then all positive).
The daily total in the weekly/monthly/year overviews then sometimes is negative and sometimes positive. I do not produce power (and the used energy meter would report it positive anyways). So negative values are definitively wrong. Tasmota does not report them.
Any ideas where these come from - or how to get rid of them? The charts are nice, but only if correct...

Re: Bar charts of energy consumption
Posted: Monday 15 January 2024 13:24
by joba1
Nevermind. This is the daily total value from tasmota. This and the yesterday total don't work as energy counter, since domoticz expects an ever increasing value, not one that counts from zero every day.
Re: Bar charts of energy consumption
Posted: Monday 15 January 2024 13:27
by waltervl
joba1 wrote: Monday 15 January 2024 13:24
Nevermind. This is the daily total value from tasmota. This and the yesterday total don't work as energy counter, since domoticz expects an ever increasing value, not one that counts from zero every day.
Then tasmoticz should create an incremental counter device and send only the delta.
Re: Bar charts of energy consumption
Posted: Monday 15 January 2024 13:59
by joba1
I just undid the change for energy today and yesterday, back to "normal" custom counters in the pr.
The energy total looks very good - all values as expected, including calculated daily values.
Maybe someone else wants to test the PR before I commit (probably in a few days...)?
See waltervl's post from oct 17th for a howto...
Re: Bar charts of energy consumption
Posted: Monday 15 January 2024 14:07
by joba1
waltervl wrote: Monday 15 January 2024 13:27
joba1 wrote: Monday 15 January 2024 13:24
Nevermind. This is the daily total value from tasmota. This and the yesterday total don't work as energy counter, since domoticz expects an ever increasing value, not one that counts from zero every day.
Then tasmoticz should create an incremental counter device and send only the delta.
not sure if handling this special case is worth the effort. I even considered to ignore these entirely since everything is already calculated from the total by domoticz. Have to think about it... For now I'll keep the custom counter.