Then it's correct, but it's not a real solution of course. One to have the freedom to choose the order.
And what about the beginAtZero?
Is it supposed to work for each Y axis separately (so three different settings), or is just a single value that controls all the Y axes in the same way?
Dashticz Graphs - Features, Fixes & Updates
Moderators: leecollings, htilburgs, robgeerts
-
clinkadink

- Posts: 417
- Joined: Tuesday 31 December 2019 1:15
- Target OS: Linux
- Domoticz version: 2020.2
- Location: Swindon, UK
- Contact:
Re: Dashticz Graphs - New Features, Fixes & Updates
Correct, it's not a solution, it was a test.
I will try a have a look at this over the next few days.
Sent from my HD1913 using Tapatalk
I will try a have a look at this over the next few days.
Sent from my HD1913 using Tapatalk
"UI is the saddle, the stirrups, & the reins. UX is the feeling you get being able to ride the horse."
-
EdwinK

- Posts: 1820
- Joined: Sunday 22 January 2017 21:46
- Target OS: Raspberry Pi / ODroid
- Domoticz version: BETA
- Location: Rhoon
- Contact:
Re: Dashticz Graphs - New Features, Fixes & Updates
Can this script be modified to get the high/low tariff from my P1 meter, with some bars
- Spoiler: show
- Screen Shot 2020-03-08 at 22.19.44.png (24.77 KiB) Viewed 1203 times
Running latest BETA on a Pi-3 | Toon® Thermostat (rooted) | Hue | Tuya | IKEA tradfri | Dashticz V3 on Lenovo Huawei Tablet | Conbee
-
clinkadink
- Posts: 417
- Joined: Tuesday 31 December 2019 1:15
- Target OS: Linux
- Domoticz version: 2020.2
- Location: Swindon, UK
- Contact:
Re: Dashticz Graphs - New Features, Fixes & Updates
Graphs in the beta branch has been updated to include the following changes:Janco wrote: ↑Saturday 07 March 2020 13:10 Then it's correct, but it's not a real solution of course. One to have the freedom to choose the order.
And what about the beginAtZero?
Is it supposed to work for each Y axis separately (so three different settings), or is just a single value that controls all the Y axes in the same way?
- Fix for custom data Y label order. The y labels for custom data were being generated using the order your devices provides the data. If this differed to the order of you custom data, you would experience the issue that you raised. This has now been fixed to allow for this scenario.
- The beginAtZero setting has been updated to accomodate multiple Y axes. For example, for a graph with 3 Y axes, you can use:
For a graph with a single Y axis, you can still use:
Code: Select all
beginAtZero: [true, false, true]Code: Select all
beginAtZero: true
"UI is the saddle, the stirrups, & the reins. UX is the feeling you get being able to ride the horse."
-
Janco
- Posts: 17
- Joined: Monday 25 April 2016 10:27
- Target OS: Raspberry Pi / ODroid
- Domoticz version:
- Contact:
Re: Dashticz Graphs - New Features, Fixes & Updates
Great. I tried it and it works now.s Thanks a lot!
-
Jimster
- Posts: 82
- Joined: Tuesday 04 February 2020 11:42
- Target OS: Raspberry Pi / ODroid
- Domoticz version: 2020.2
- Location: The Netherlands
- Contact:
Re: Dashticz Graphs - New Features, Fixes & Updates
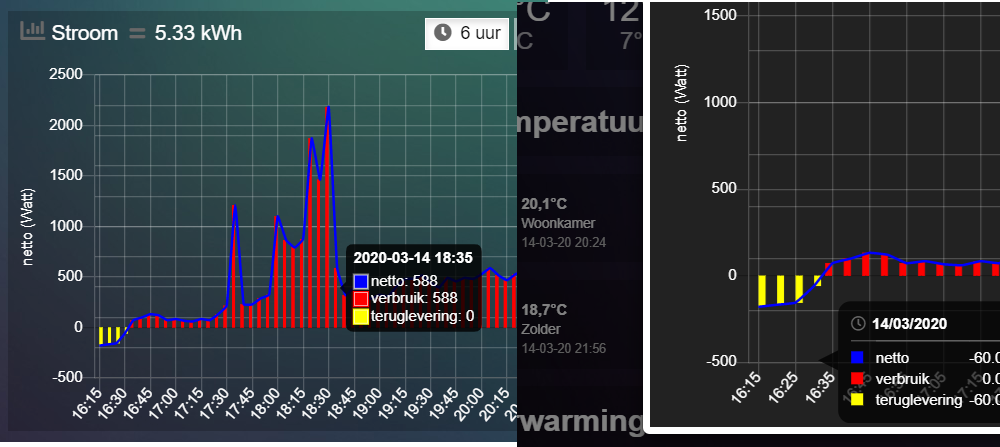
When I click on the line or bar on a popup graph, I see the the date and value at that moment, the time is missing. Whith a graph on the dash, the time is visible. Any idea why the time is missing in a popup graph?
-
clinkadink
- Posts: 417
- Joined: Tuesday 31 December 2019 1:15
- Target OS: Linux
- Domoticz version: 2020.2
- Location: Swindon, UK
- Contact:
Re: Dashticz Graphs - New Features, Fixes & Updates
Any chance you could provide a screenshot of this? Thanks.
"UI is the saddle, the stirrups, & the reins. UX is the feeling you get being able to ride the horse."
-
Jimster
- Posts: 82
- Joined: Tuesday 04 February 2020 11:42
- Target OS: Raspberry Pi / ODroid
- Domoticz version: 2020.2
- Location: The Netherlands
- Contact:
Re: Dashticz Graphs - New Features, Fixes & Updates
On the left a graph on the dashboard, time is visible behind the date.clinkadink wrote: ↑Saturday 14 March 2020 21:38Any chance you could provide a screenshot of this? Thanks.
On the right the same graph behind a block, no time visible. I see the date format is also different.
-
clinkadink
- Posts: 417
- Joined: Tuesday 31 December 2019 1:15
- Target OS: Linux
- Domoticz version: 2020.2
- Location: Swindon, UK
- Contact:
Re: Dashticz Graphs - New Features, Fixes & Updates
Thanks.
Popups now default to using the recently implemented HTML tooltips (from last month). Whereas the default for graphs is the standard 'rendered' tooltip. You can enable the HTML tooltip on your graph by adding ...
The date format for HTML tooltips is set to show the date only when the range is set to 'month'. But I can see from your graph your range is set to 'day'. I will look in to why this is and report back.
Popups now default to using the recently implemented HTML tooltips (from last month). Whereas the default for graphs is the standard 'rendered' tooltip. You can enable the HTML tooltip on your graph by adding ...
Code: Select all
toolTipStyle: true,"UI is the saddle, the stirrups, & the reins. UX is the feeling you get being able to ride the horse."
-
Jimster
- Posts: 82
- Joined: Tuesday 04 February 2020 11:42
- Target OS: Raspberry Pi / ODroid
- Domoticz version: 2020.2
- Location: The Netherlands
- Contact:
Re: Dashticz Graphs - New Features, Fixes & Updates
I've updated to the latest beta, it works now. Oops, should have tried that first.clinkadink wrote: ↑Saturday 14 March 2020 22:33 Thanks.
Popups now default to using the recently implemented HTML tooltips (from last month). Whereas the default for graphs is the standard 'rendered' tooltip. You can enable the HTML tooltip on your graph by adding ...The date format for HTML tooltips is set to show the date only when the range is set to 'month'. But I can see from your graph your range is set to 'day'. I will look in to why this is and report back.Code: Select all
toolTipStyle: true,
-
clinkadink
- Posts: 417
- Joined: Tuesday 31 December 2019 1:15
- Target OS: Linux
- Domoticz version: 2020.2
- Location: Swindon, UK
- Contact:
Re: Dashticz Graphs - New Features, Fixes & Updates
OK, thanks for letting me know
"UI is the saddle, the stirrups, & the reins. UX is the feeling you get being able to ride the horse."
-
webrazor
- Posts: 61
- Joined: Monday 09 November 2015 9:33
- Target OS: Raspberry Pi / ODroid
- Domoticz version:
- Location: The Netherlands
- Contact:
Re: Dashticz Graphs - New Features, Fixes & Updates
Is this only in beta version or also in the latest stable 2020.1?
-
clinkadink
- Posts: 417
- Joined: Tuesday 31 December 2019 1:15
- Target OS: Linux
- Domoticz version: 2020.2
- Location: Swindon, UK
- Contact:
Re: Dashticz Graphs - New Features, Fixes & Updates
Beta (above) refers to the Dashticz beta, not Domoticz.
https://github.com/Dashticz/dashticz/tree/beta
"UI is the saddle, the stirrups, & the reins. UX is the feeling you get being able to ride the horse."
-
webrazor
- Posts: 61
- Joined: Monday 09 November 2015 9:33
- Target OS: Raspberry Pi / ODroid
- Domoticz version:
- Location: The Netherlands
- Contact:
Re: Dashticz Graphs - New Features, Fixes & Updates
offcourse dashticz, only in beta yet.
-
clinkadink
- Posts: 417
- Joined: Tuesday 31 December 2019 1:15
- Target OS: Linux
- Domoticz version: 2020.2
- Location: Swindon, UK
- Contact:
Re: Dashticz Graphs - New Features, Fixes & Updates


"UI is the saddle, the stirrups, & the reins. UX is the feeling you get being able to ride the horse."
-
Jimster
- Posts: 82
- Joined: Tuesday 04 February 2020 11:42
- Target OS: Raspberry Pi / ODroid
- Domoticz version: 2020.2
- Location: The Netherlands
- Contact:
Re: Dashticz Graphs - New Features, Fixes & Updates
Works great! Looks a lot better.
-
clinkadink
- Posts: 417
- Joined: Tuesday 31 December 2019 1:15
- Target OS: Linux
- Domoticz version: 2020.2
- Location: Swindon, UK
- Contact:
Re: Dashticz Graphs - New Features, Fixes & Updates
Good news, always a relief to hear 
"UI is the saddle, the stirrups, & the reins. UX is the feeling you get being able to ride the horse."
-
Boattailman
- Posts: 14
- Joined: Thursday 05 March 2020 23:04
- Target OS: Raspberry Pi / ODroid
- Domoticz version: 2020.2
- Contact:
Re: Dashticz Graphs - New Features, Fixes & Updates
The stacked is true is not working on my graph:

- Spoiler: show
-
clinkadink
- Posts: 417
- Joined: Tuesday 31 December 2019 1:15
- Target OS: Linux
- Domoticz version: 2020.2
- Location: Swindon, UK
- Contact:
Re: Dashticz Graphs - New Features, Fixes & Updates
Your block config code is incomplete, I have corrected this below.Boattailman wrote: ↑Monday 30 March 2020 9:15 The stacked is true is not working on my graph:Probably some stupid mistake from my side
- Spoiler: show
- Spoiler: show
"UI is the saddle, the stirrups, & the reins. UX is the feeling you get being able to ride the horse."
Who is online
Users browsing this forum: No registered users and 1 guest